
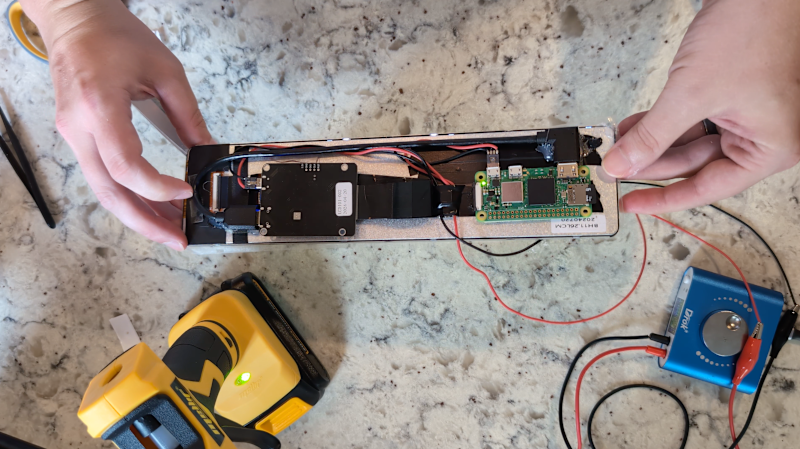
This unique wall sconce welcomes you home with warm light
Reading Time: 2 minutesHave you ever walked through your front door after a long day of work and…
Reading Time: 4 minutes4 years ago I decided to start a new CoderDojo in my community. The logic was simple: to provide the best support…
> EXECUTE_ARTICLE_VIEW
Reading Time: 2 minutesHave you ever walked through your front door after a long day of work and…

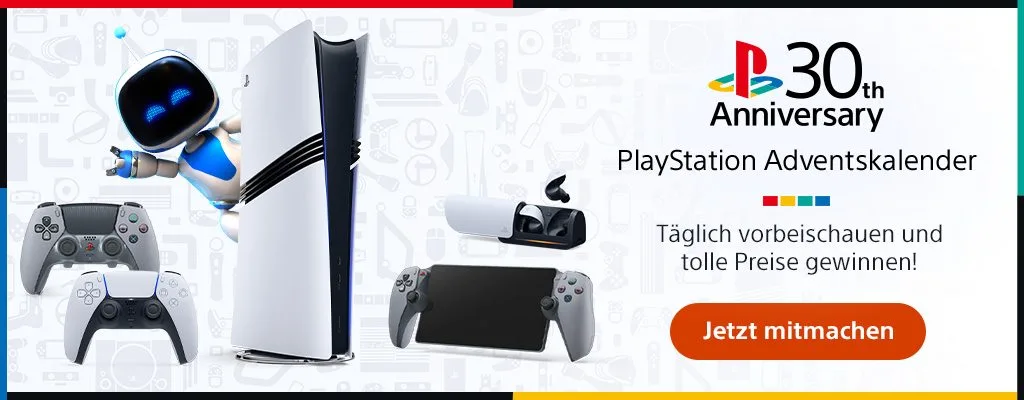
Reading Time: 2 minutesSeit der Einführung der ersten PlayStation-Konsole am 3. Dezember 1994 definiert PlayStation das Gaming Jahr…

Reading Time: 2 minutesThe human face is remarkably complex, with 43 different muscles contorting the skin in all…
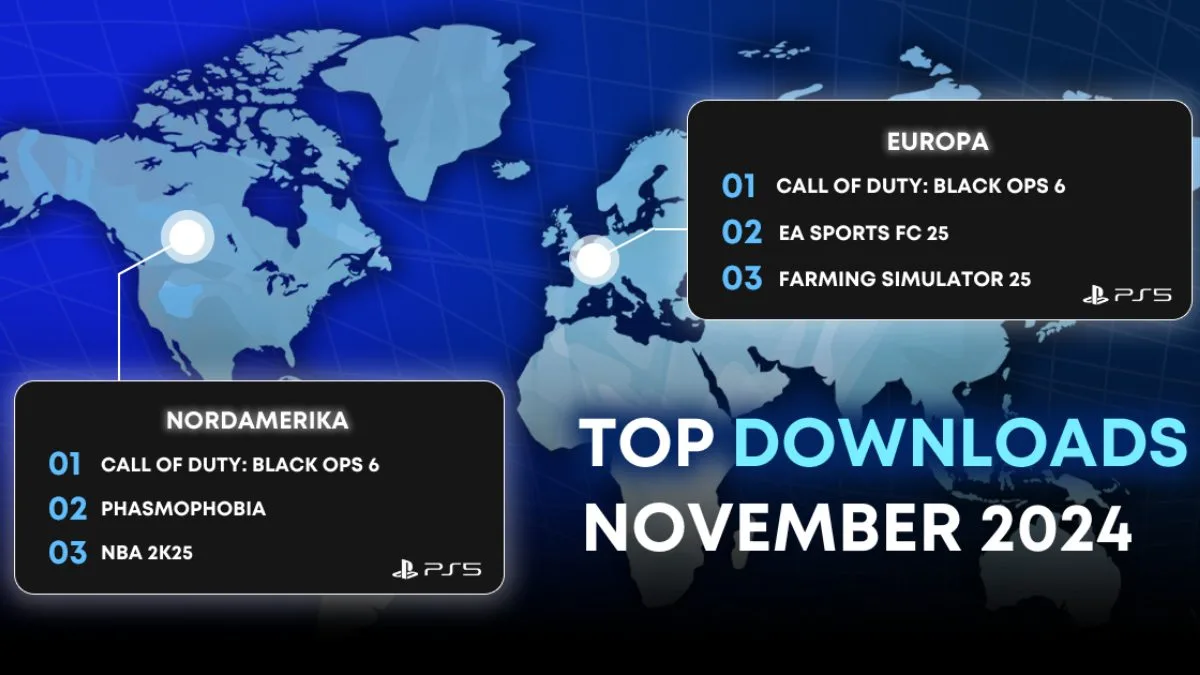
Reading Time: 2 minutesEs ist an der Zeit zu sehen, welche PS5-, PS4-, PS VR2-, PS VR- und…
Reading Time: 5 minutes“I love the idea of using bumper stickers as a form of self-expression, but I…
Reading Time: 9 minutesHallo, PlayStation-Fans! In Fortnite passiert gerade eine ganze Menge! Wenn ihr während der kommenden Festtage…
Reading Time: 3 minutesErkundet das dunkle, verdrehte Reich Wraeclast, wenn Path of Exile 2 Early Access heute auf…
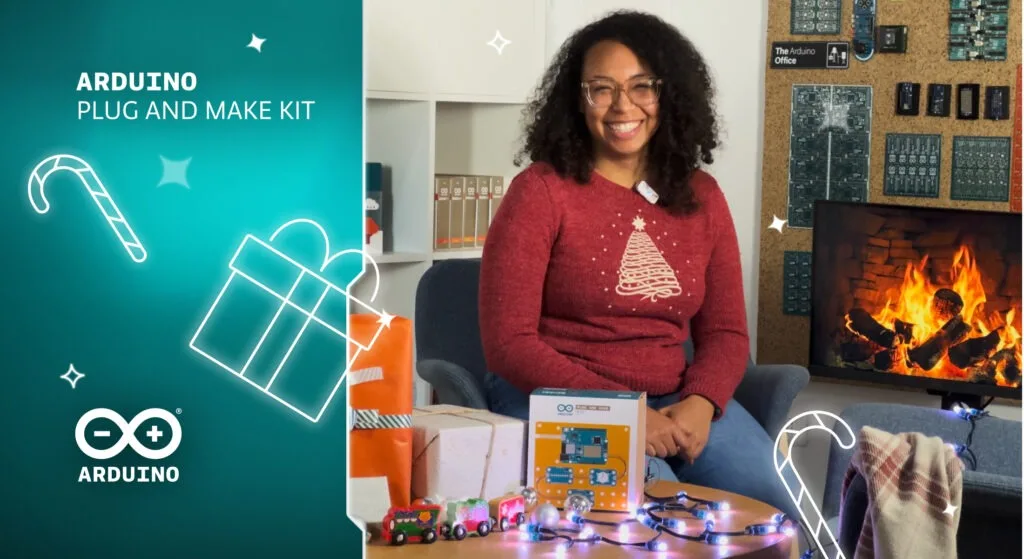
Reading Time: 2 minutesLooking for a fun and creative way to brighten up the holiday season? With the…
Reading Time: 6 minutesHallo, Proxys! Ich grüße euch vom Entwicklerteam von Zenless Zone Zero. Ich bin Cross Shi,…

Reading Time: 4 minutesMein Name ist Jenny und ich bin die Kommunikationsdirektorin von Ivy Road, dem Indie-Studio, das…
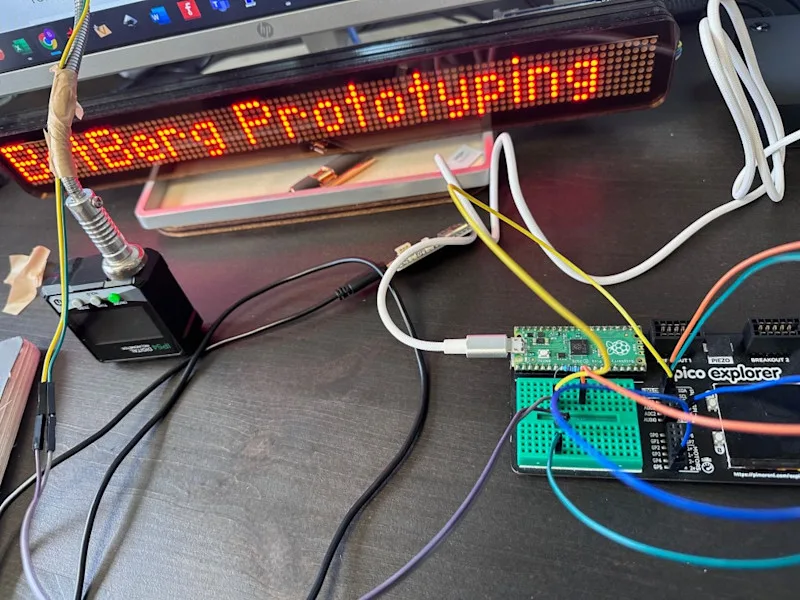
Reading Time: 2 minutes“Using a Raspberry Pi Pico, a light dependent resistor (LDR), a breadboard, some DuPont cables,…
Reading Time: < 1 minuteLearn more about the latest Pixel and Android updates, featuring the latest in Google…
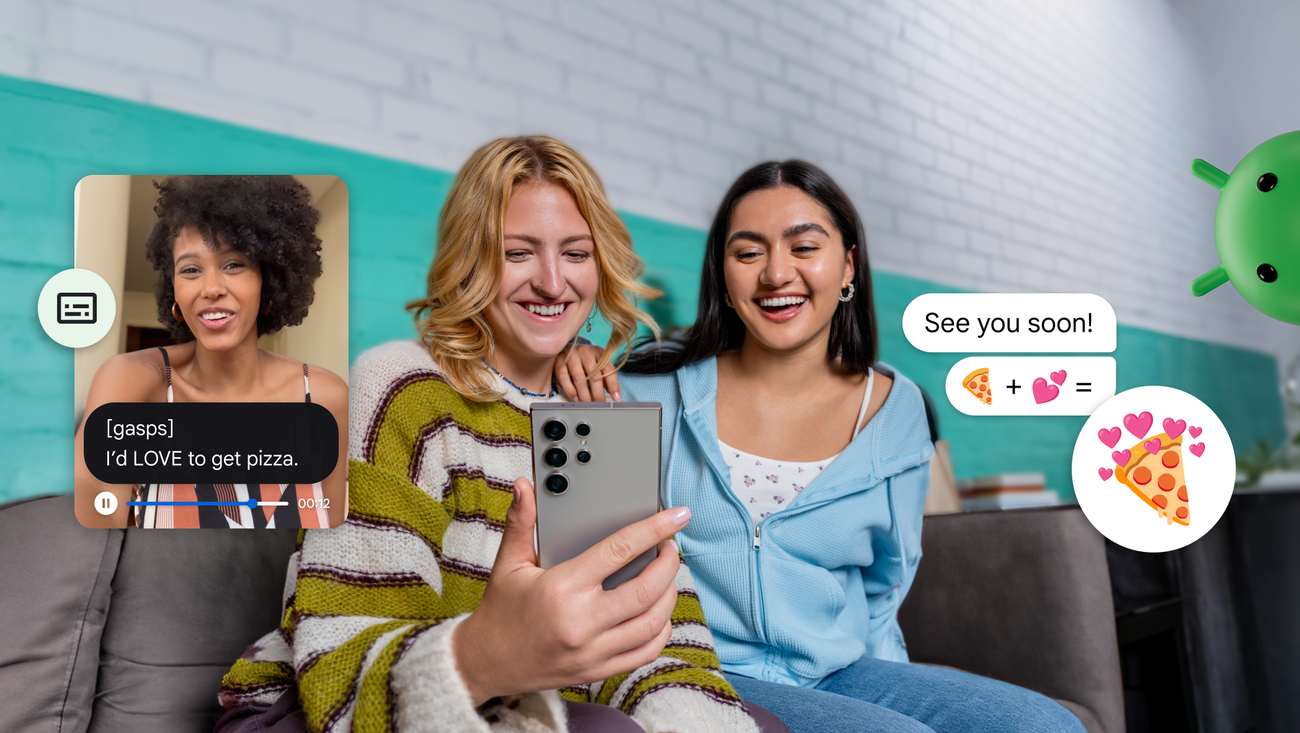
Reading Time: < 1 minuteNew Android features connect your digital and physical worlds, from expressive audio captions to…
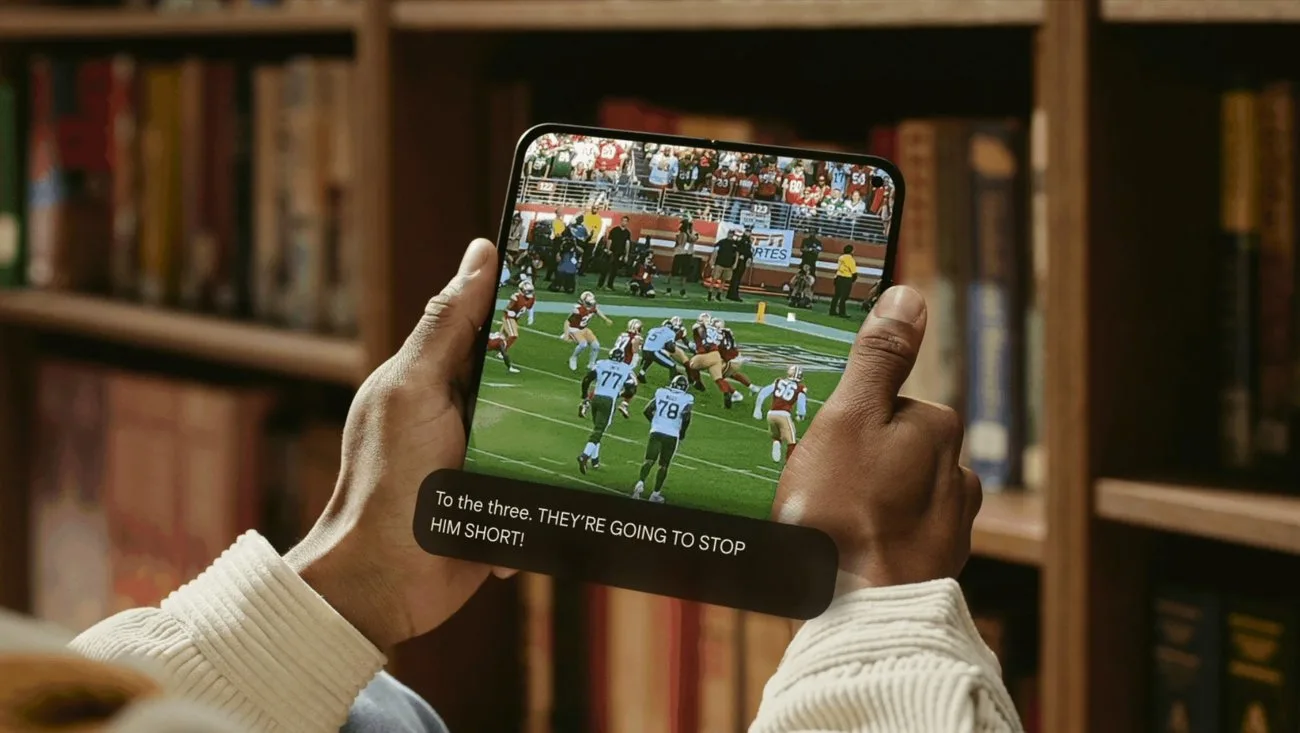
Reading Time: < 1 minuteWe’re launching Expressive Captions, a feature of Live Caption, that gives you the full…

Reading Time: 3 minutesMit der Einführung der PlayStation Tournaments auf PS5 ist eine Community aus kompetitiven Spielern und…
Reading Time: 3 minutesLast July, when we announced the beginning of the transition from Mbed to Zephyr, we…

Reading Time: 3 minutesThe digital skills gap is one of the biggest challenges for today’s workforce. It’s a…

Reading Time: 2 minutesWie ist es, einen K-Pop-Hit aus dem Album Barbie in ein VR-Rhythmusspiel zu bringen? Es…

Reading Time: 3 minutesIn unserer kommenden Veröffentlichung von Star Wars Episode I: Jedi Power Battles, die am 23.…

Reading Time: 3 minutesHallo zusammen! Ich bin Nobuo Uematsu, der Komponist von Fantasian Neo Dimension. Als mich Produzent…

Reading Time: 5 minutesWährend wir gespannt auf die Ankunft von Legacy of Kain Soul Reaver 1 & 2…

Reading Time: 4 minutes„Bleach Rebirth of Souls“ ist das neueste Konsolenspiel aus der legendären ‚Bleach‘-Reihe, in dem die…