
Part of our work in the consortium behind the National Centre for Computing Education (NCCE) is to produce free classroom resources for teachers to deliver the Computing curriculum to students aged 5–16 in England. Our Director of Educator Support Carrie Anne Philbin describes how we define and represent progression in these resources.
For our work to develop a complete bank of free teaching resources that help teachers deliver the Computing curriculum in England, we knew that a strong progression framework is absolutely crucial. A progression framework is the backbone of any subject curriculum: it defines the sequence in which students learn, noting where core understanding of a topic is established in order to progress.

What’s the best approach to present progression?
We studied a lot of progression frameworks, examination specifications, and even some research papers. What we found is that there are two quite different ways of presenting progression that show what should be taught and when it should be taught, as well as information on how or why concepts should be taught.
Listing is one option
Firstly, there is the approach of creating a categorisation of skills and concepts into a list or table. Sequencing is shown by having objectives listed by Key Stage, year group, or even by learners’ age. Examples of this approach include the CAS computing progression pathways and the Massachusetts Digital Literacy and Computer Science Curriculum Framework. They are essentially lists of required knowledge that’s bundled by theme.

Mapping trajectories is another approach
Another approach is to use a map of possible trajectories through learning waypoints and importantly how they connect to each other. This approach highlights where prerequisite knowledge needs to be mastered before students can move on, as well as the dependent knowledge contained in other nodes that need to be mastered in order to progress.

Cambridge Mathematics are leading the way in “developing a flexible and interconnected digital Framework to help reimagine mathematics education 3-19”. We’ve been lucky enough to learn from their work, which has helped us to create learning graphs.
We develop learning graphs
For our free classroom resources, we organise computing content (concepts, knowledge, skills, and objectives) into interconnected networks we call learning graphs. We found that nodes often form clusters corresponding to specific themes, and we can connect them if they represent two adjacent waypoints in the learning process. Depending on the level of abstraction, the nodes in a learning graph contain anything ranging from the contents of a curriculum strand across an entire Key Stage, to the learning objectives of a six-lesson unit.
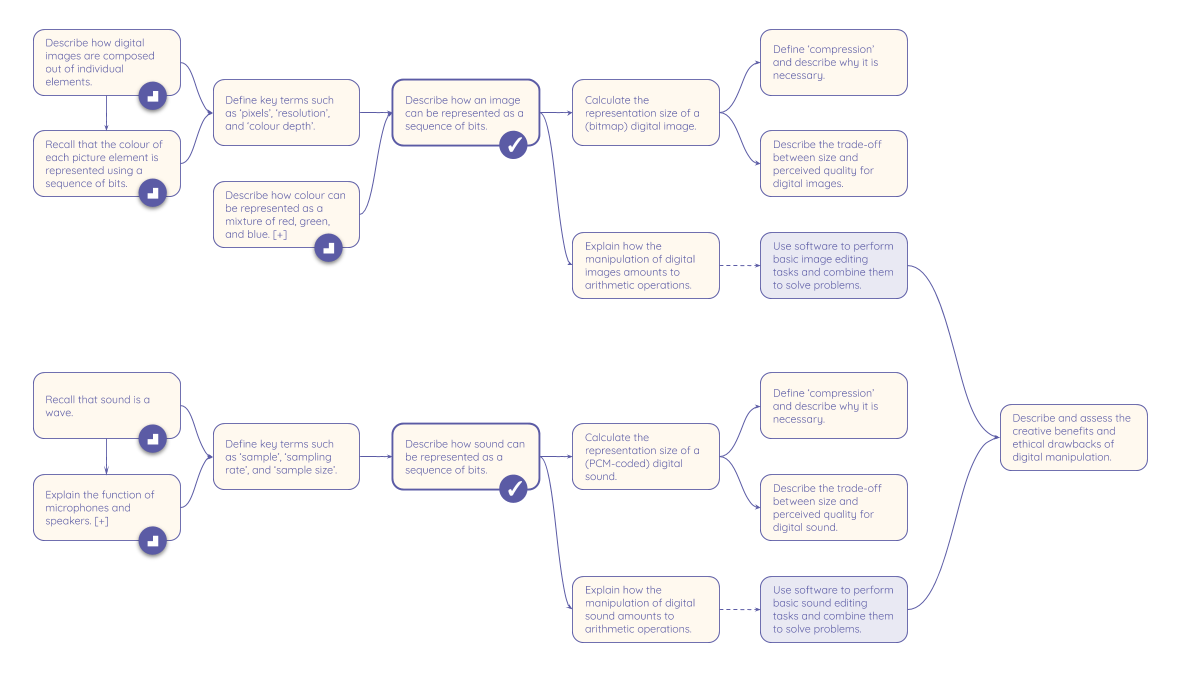
The learning graph for the Year 9 unit ‘Representations: going audiovisual’. Click to embiggen.
Initially, the graphs we produce are in a fluid state: they uncover the structure of the content and the possible journeys through it, without being bound to a specific teaching pathway. As we develop the content further, the graphs eventually reach a solid state, where the nodes are arranged to reflect our suggestions on the order in which teachers could actually deliver the content.
Learning graphs are doubly useful
We believe that learning graphs are useful to teachers on a whole new level: they directly inform lesson planning, but they also add value by showing opportunities to assess understanding at landmark waypoints in a lesson or unit. By checking that students are grasping the concepts, teachers are able to think more about how they are teaching and can revisit knowledge that perhaps didn’t land with learners the first time.
We need teachers’ feedback
All progression frameworks are subjective, and because so far there’s only little research into computing education, we rely on teachers’ experience of combining the ‘what’ we teach and ‘how’ to teach it in order to help inform this work. If you’ve not taken a look at our learning graphs for the NCCE Resource Repository, access them via teachcomputing.org/resources and let us know your thoughts via [email protected].
A version of this article will be part of the upcoming issue of Hello World, our free magazine for computing educators, launching on 23 March. Follow Hello World on Twitter for updates!
Website: LINK
Schreibe einen Kommentar
Du musst angemeldet sein, um einen Kommentar abzugeben.