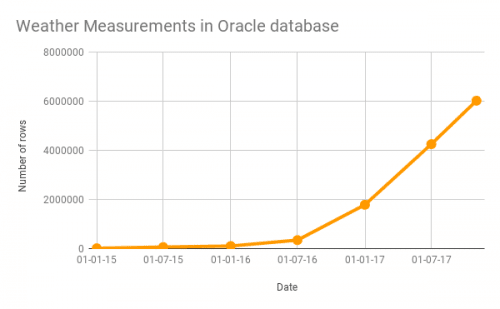
Since we launched the Oracle Weather Station project, we’ve collected more than six million records from our network of stations at schools and colleges around the world. Each one of these records contains data from ten separate sensors — that’s over 60 million individual weather measurements!

Weather station measurements in Oracle database
Weather data collection
Having lots of data covering a long period of time is great for spotting trends, but to do so, you need some way of visualising your measurements. We’ve always had great resources like Graphing the weather to help anyone analyse their weather data.
And from now on its going to be even easier for our Oracle Weather Station owners to display and share their measurements. I’m pleased to announce a new partnership with our friends at Initial State: they are generously providing a white-label platform to which all Oracle Weather Station recipients can stream their data.
Using Initial State
Initial State makes it easy to create vibrant dashboards that show off local climate data. The service is perfect for having your Oracle Weather Station data on permanent display, for example in the school reception area or on the school’s website.
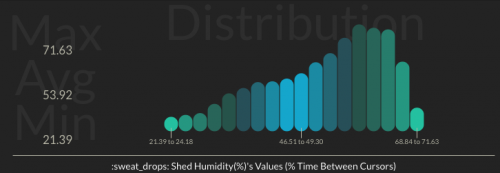
But that’s not all: the Initial State toolkit includes a whole range of easy-to-use analysis tools for extracting trends from your data. Distribution plots and statistics are just a few clicks away!

Looks like Auntie Beryl is right — it has been a damp old year! (Humidity value distribution May–Nov 2017)
The wind direction data from my Weather Station supports my excuse as to why I’ve not managed a high-altitude balloon launch this year: to use my launch site, I need winds coming from the east, and those have been in short supply.

Chart showing wind direction over time
Initial State credientials
Every Raspberry Pi Oracle Weather Station school will shortly be receiving the credentials needed to start streaming their data to Initial State. If you’re super keen though, please email weather@raspberrypi.org with a photo of your Oracle Weather Station, and I’ll let you jump the queue!
The Initial State folks are big fans of Raspberry Pi and have a ton of Pi-related projects on their website. They even included shout-outs to us in the music video they made to celebrate the publication of their 50th tutorial. Can you spot their weather station?
Your home-brew weather station
If you’ve built your own Raspberry Pi–powered weather station and would like to dabble with the Initial State dashboards, you’re in luck! The team at Initial State is offering 14-day trials for everyone. For more information on Initial State, and to sign up for the trial, check out their website.
Website: LINK
