Chris Aviles, aka the teacher we all wish we’d had when we were at school, discusses how his school is in New Jersey is directly linking data with life itself…
Over to you, Chris.
Every year, our students take federal or state-mandated testing, but what significant changes have we made to their education with the results of these tests? We have never collected more data about our students and society in general. The problem is most people and institutions do a poor job interpreting data and using it to make meaningful change. This problem was something I wanted to tackle in FH Grows.
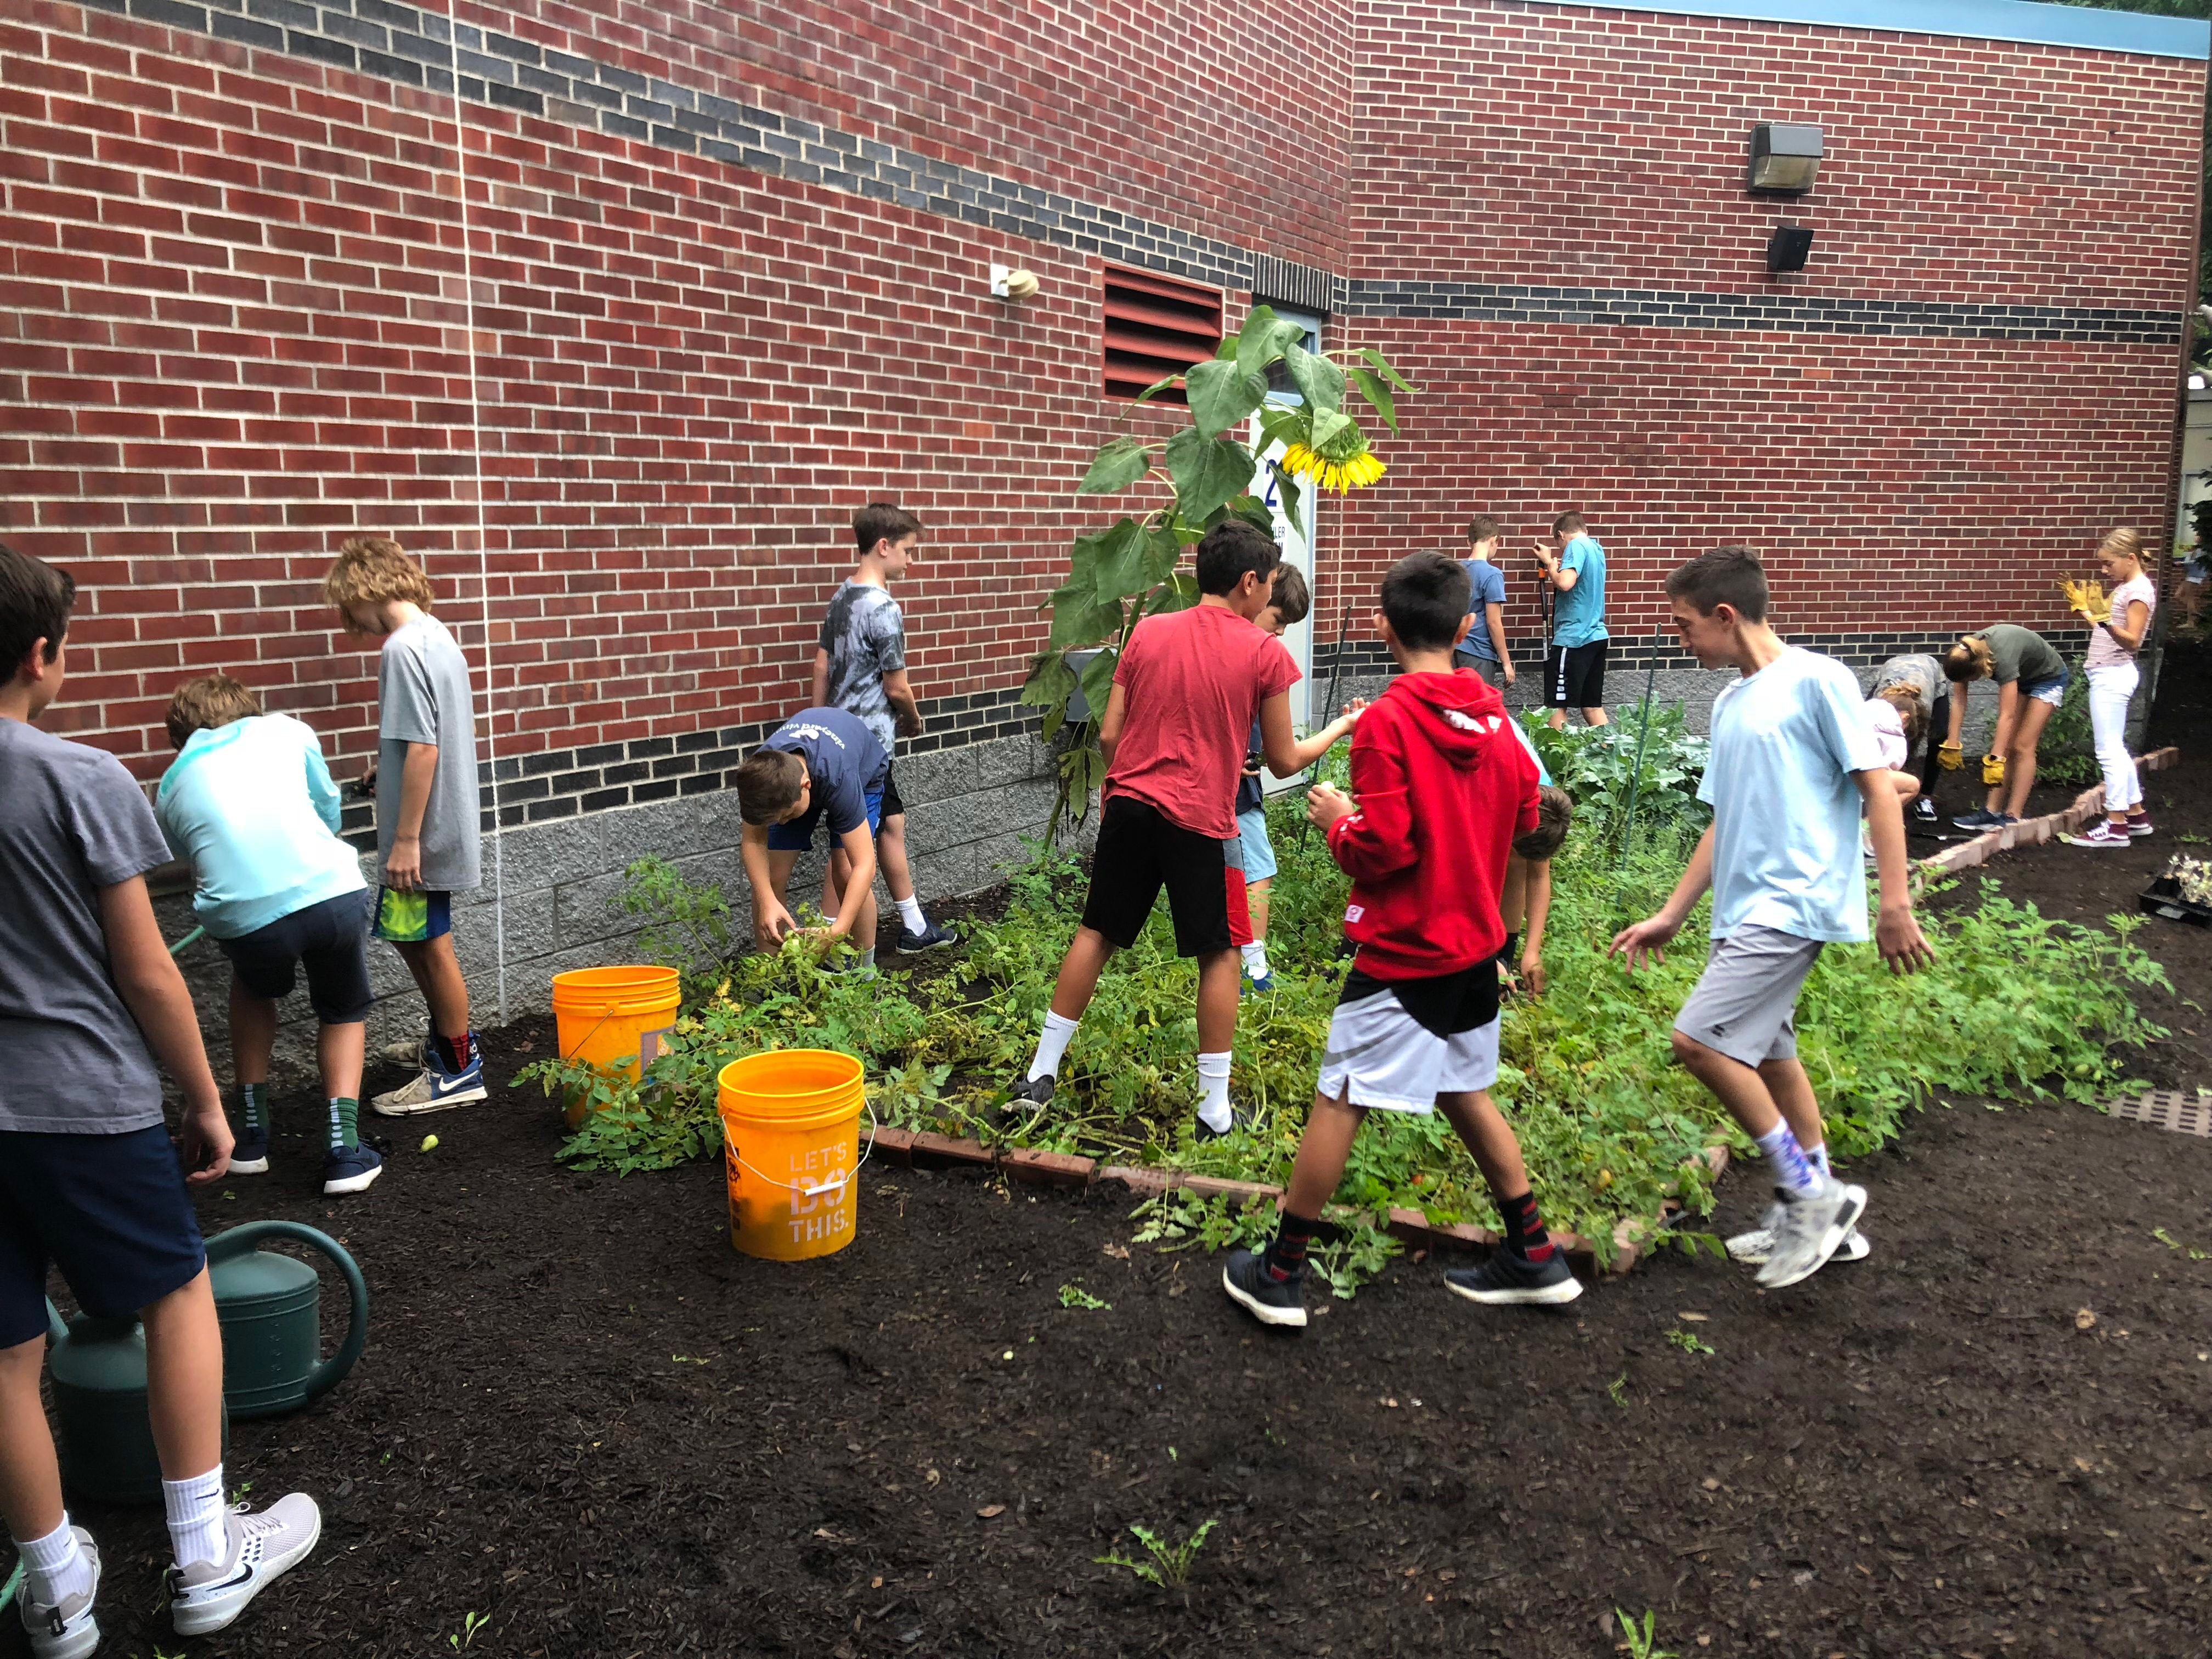
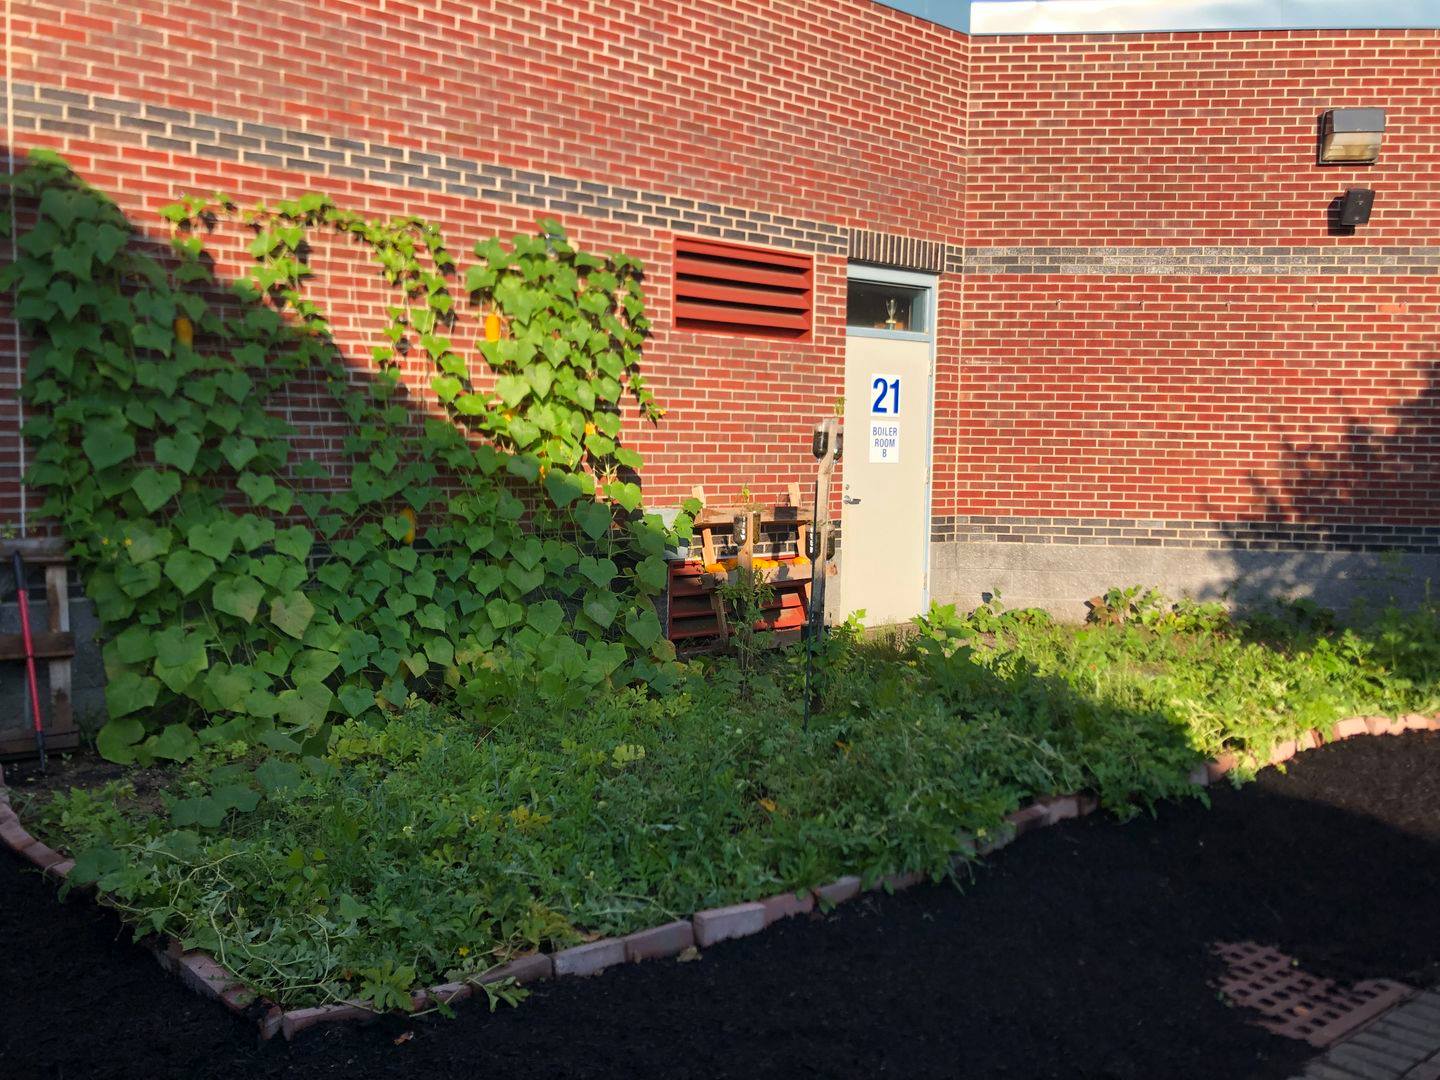
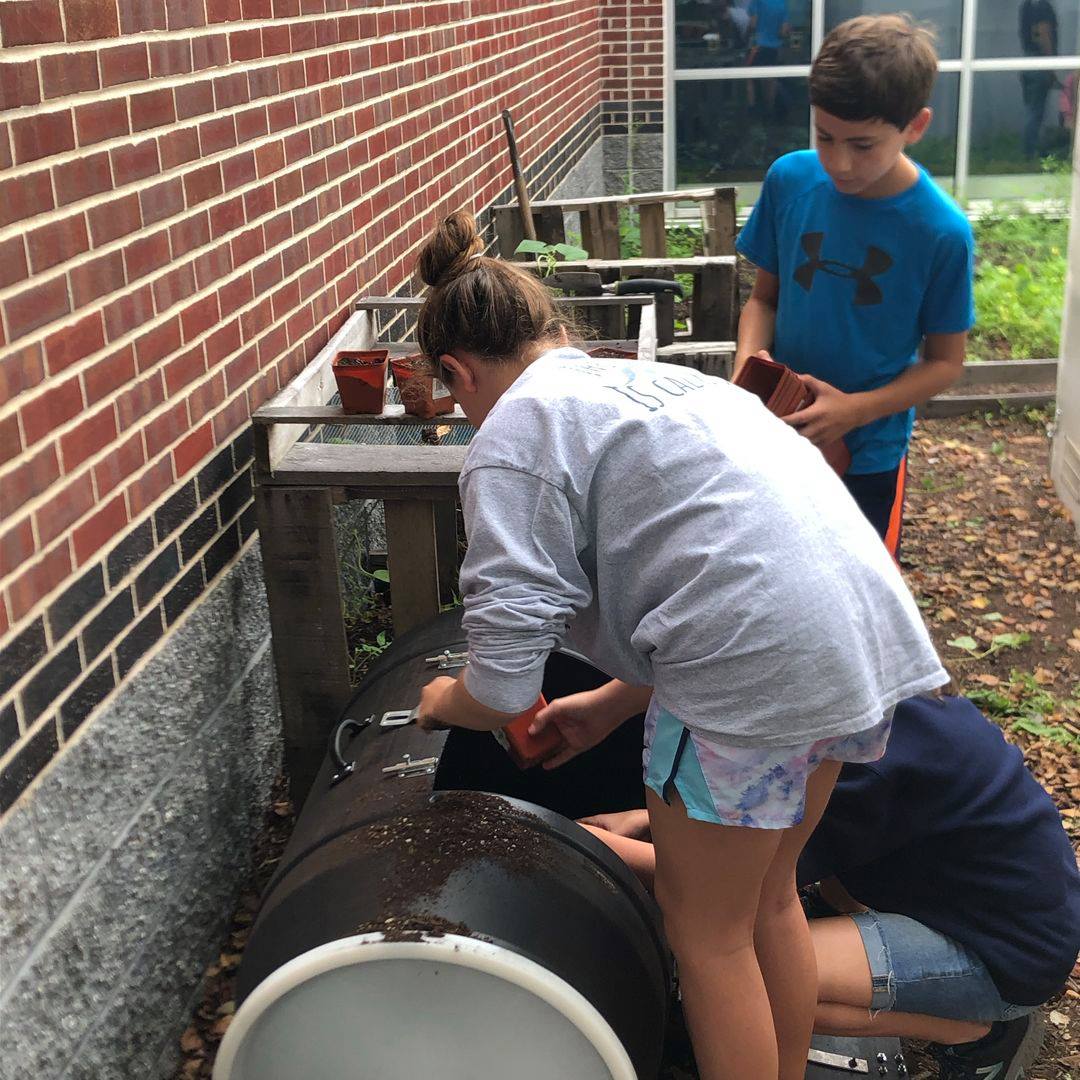
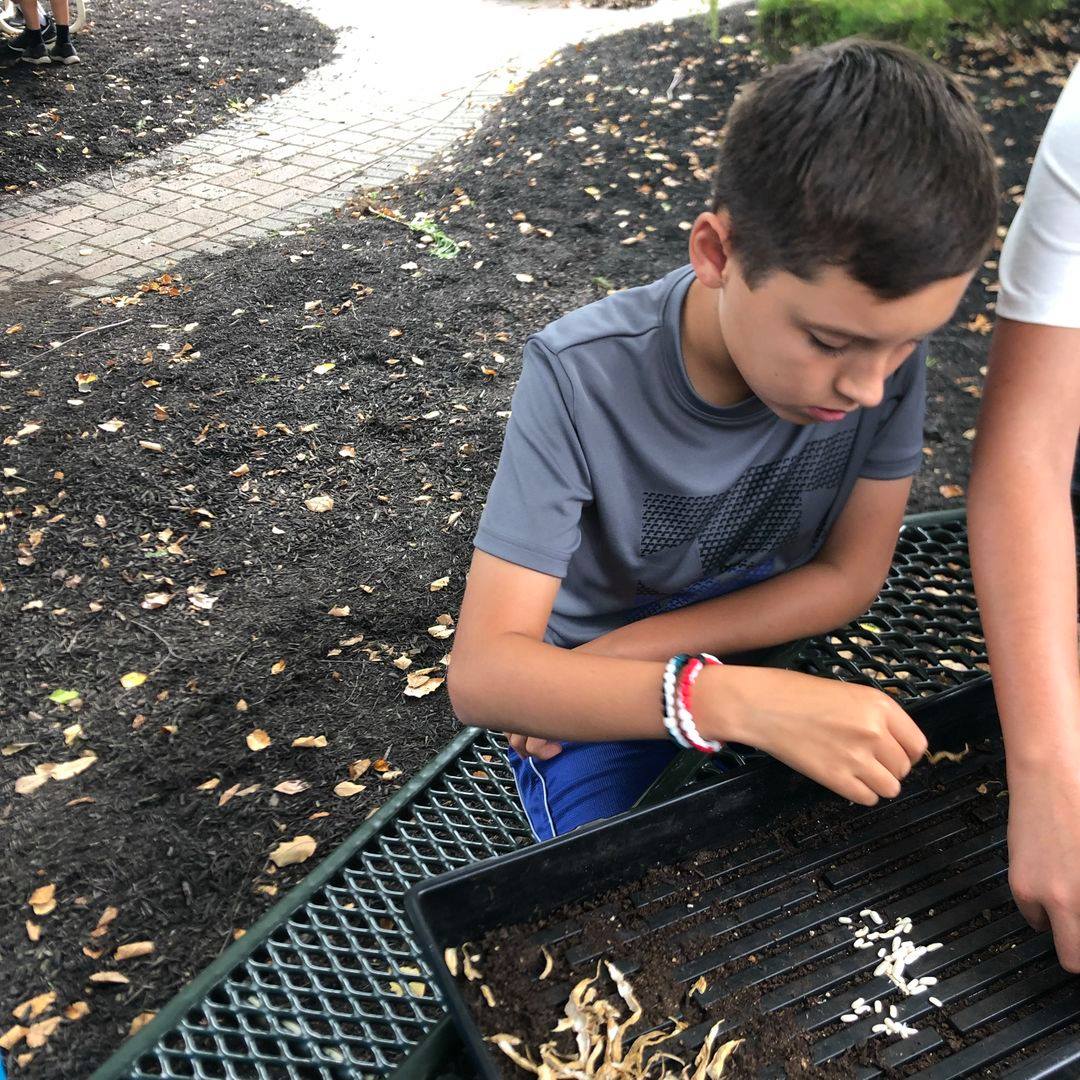
FH Grows is the name of my seventh-grade class, and is a student-run agriculture business at Knollwood Middle School in Fair Haven, New Jersey. In FH Grows, we sell our produce both online and through our student-run farmers markets. Any produce we don’t sell is donated to our local soup kitchen. To get the most out of our school gardens, students have built sensors and monitors using Raspberry Pis. These sensors collect data which then allows me to help students learn to better interpret data themselves and turn it into action.
Turning data into action
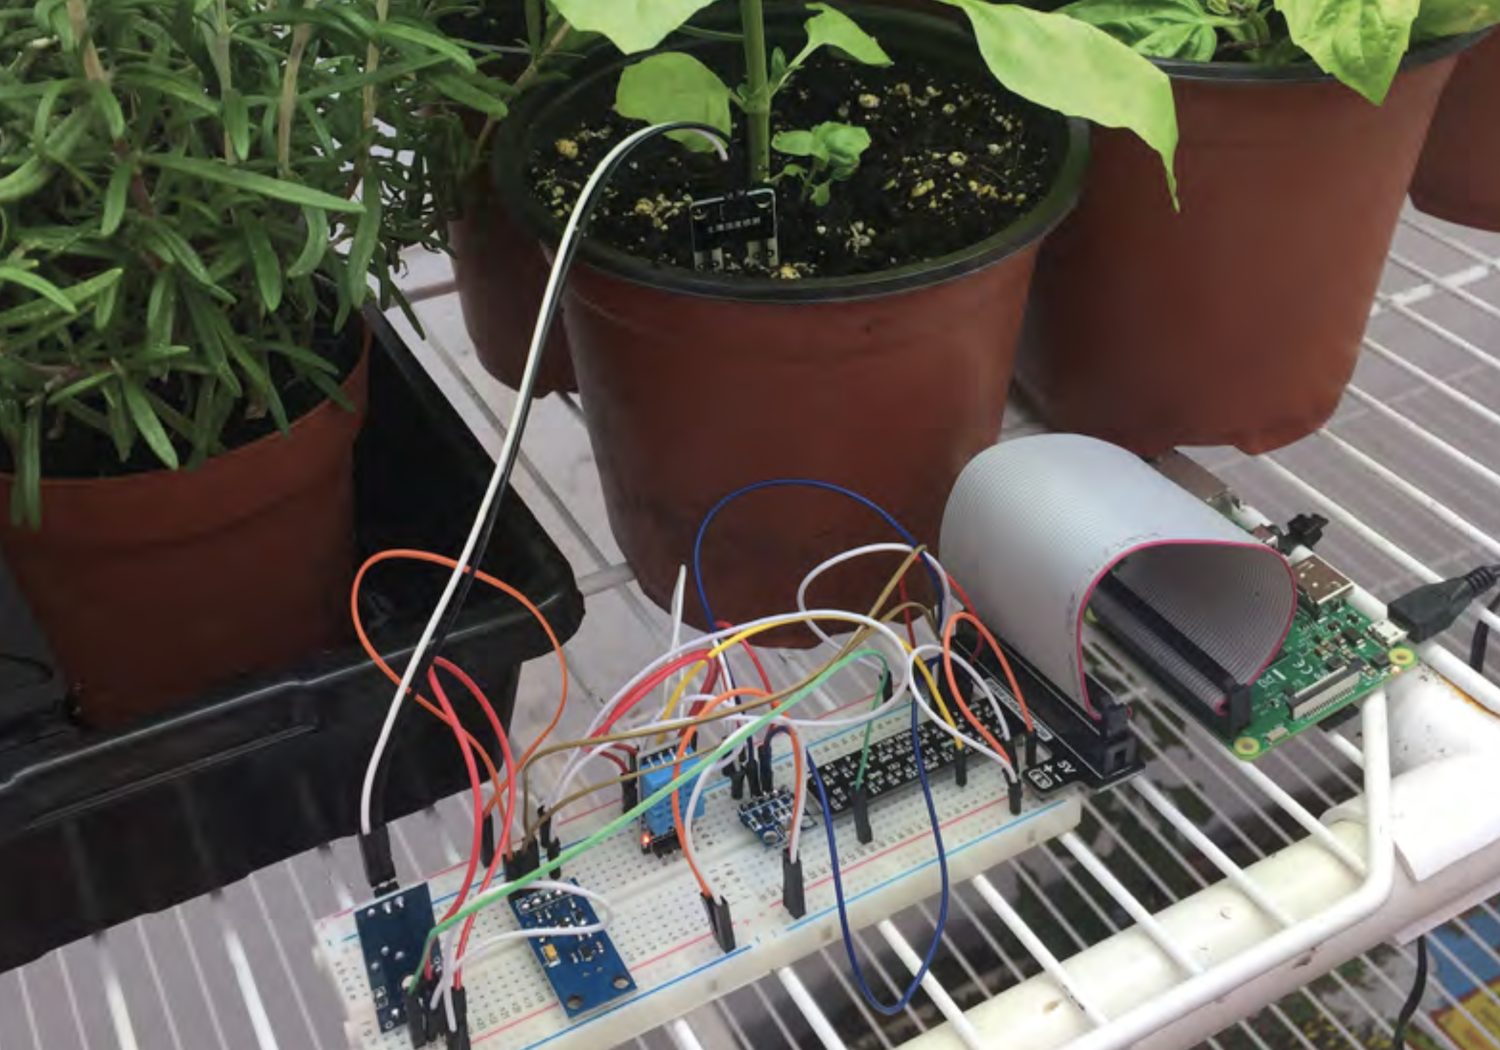
In the greenhouse, our gardens, and alternative growing stations (hydroponics, aquaponics, aeroponics) we have sensors that log the temperature, humidity, and other important data points that we want to know about our garden. This data is then streamed in real time, online at FHGrows.com. When students come into the classroom, one of the first things we look at is the current, live data on the site and find out what is going on in our gardens. Over the course of the semester, students are taught about the ideal growing conditions of our garden. When looking at the data, if we see that the conditions in our gardens aren’t ideal, we get to work.
If we see that the greenhouse is too hot, over 85 degrees, students will go and open the greenhouse door. We check the temperature a little bit later, and if it’s still too hot, students will go turn on the fan. But how many fans do you turn on? After experimenting, we know that each fan lowers the greenhouse temperature between 7-10 degrees Fahrenheit. Opening the door and turning on both fans can bring a greenhouse than can push close to 100 degrees in late May or early June down to a manageable 80 degrees.
Turning data into action can allow for some creativity as well. Over-watering plants can be a real problem. We found that our plants were turning yellow because we were watering them every day when we didn’t need to. How could we solve this problem and become more efficient at watering? Students built a Raspberry Pi that used a moisture sensor to find out when a plant needed to be watered. We used a plant with the moisture sensor in the soil as our control plant. We figured that if we watered the control plant at the same time we watered all our other plants, when the control plant was dry (gave a negative moisture signal) the rest of the plants in the greenhouse would need to be watered as well.
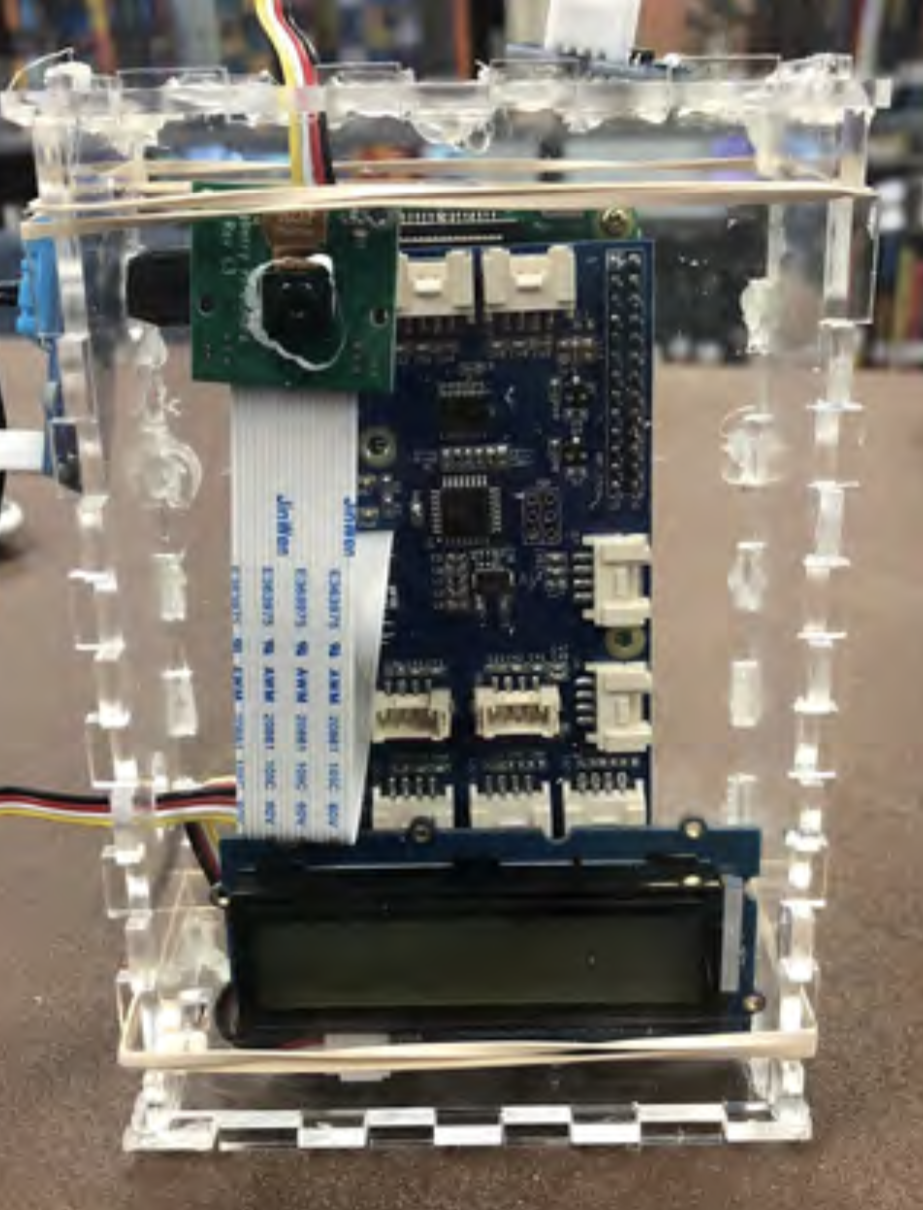
This method of determining when to water our plants worked well. We rarely ever saw our plants turn yellow from overwatering. Here is where the creativity came in. Since we received a signal from the Raspberry Pi when the soil was not wet enough, we played around with what we could do with that signal. We displayed it on the dashboard along with our other data, but we also decided to make the signal send as an email from the plant. When I showed students how this worked, they decided to write the message from the plant in the first person. Every week or so, we received an email from Carl the Control Plant asking us to come out and water him!
If students don’t honour Carl’s request for water, use data to know when to cool our greenhouse, or had not done the fan experiments to see how much cooler they make the greenhouse, all our plants, like the basil we sell to the pizza places in town, would die. This is the beauty of combining data literacy with a school garden: failure to interpret data then act based on their interpretation has real consequences: our produce could die. When it takes 60-120 days to grow the average vegetable, the loss of plants is a significant event. We lose all the time and energy that went into growing those plants as well as lose all the revenue they would have brought in for us. Further, I love the urgency that combining data and the school garden creates because many students have learned the valuable life lesson that not making a decision is making a decision. If students freeze or do nothing when confronted with the data about the garden, that too has consequences.
Using data to spot trends and make predictions
The other major way we use data in FH Grows is to spot trends and make predictions. Different to using data to create the ideal growing conditions in our garden every day, the sensors that we use also provide a way for us to use information about the past to predict the future. FH Grows has about two years’ worth of weather data from our Raspberry Pi weather station (there are guides online if you wish to build a weather station of your own). Using weather data year over year, we can start to determine important events like when it is best to plant our veggies in our garden.
For example, one of the most useful data points on the Raspberry Pi weather station is the ground temperature sensor. Last semester, we wanted to squeeze in a cool weather grow in our garden. This post-winter grow can be done between March and June if you time it right. Getting an extra growing cycle from our garden is incredibly valuable, not only to FH Grows as business (since we would be growing more produce to turn around and sell) but as a way to get an additional learning cycle out of the garden.
So, using two seasons’ worth of ground temperature data, we set out to predict when the ground in our garden would be cool enough to do this cool veggie grow. Students looked at the data we had from our weather station and compared it to different websites that predicted the last frost of the season in our area. We found that the ground right outside our door warmed up two weeks earlier than the more general prediction given by websites. With this information we were able to get a full cool crop grow at a time where our garden used to lay dormant.
We also used our Raspberry Pi to help us predict whether or not it was going to rain over the weekend. Using a Raspberry Pi connected to Weather Underground and previous years’ data, if we believed it would not rain over the weekend we would water our gardens on Friday. If it looked like rain over the weekend, we let Mother Nature water our garden for us. Our prediction using the Pi and previous data was more accurate for our immediate area than compared to the more general weather reports you would get on the radio or an app, since those considered a much larger area when making their prediction.
It seems like we are going to be collecting even more data in the future, not less. It is important that we get our students comfortable working with data. The school garden supported by Raspberry Pi’s amazing ability to collect data is a boon for any teacher who wants to help students learn how to interpret data and turn it into action.
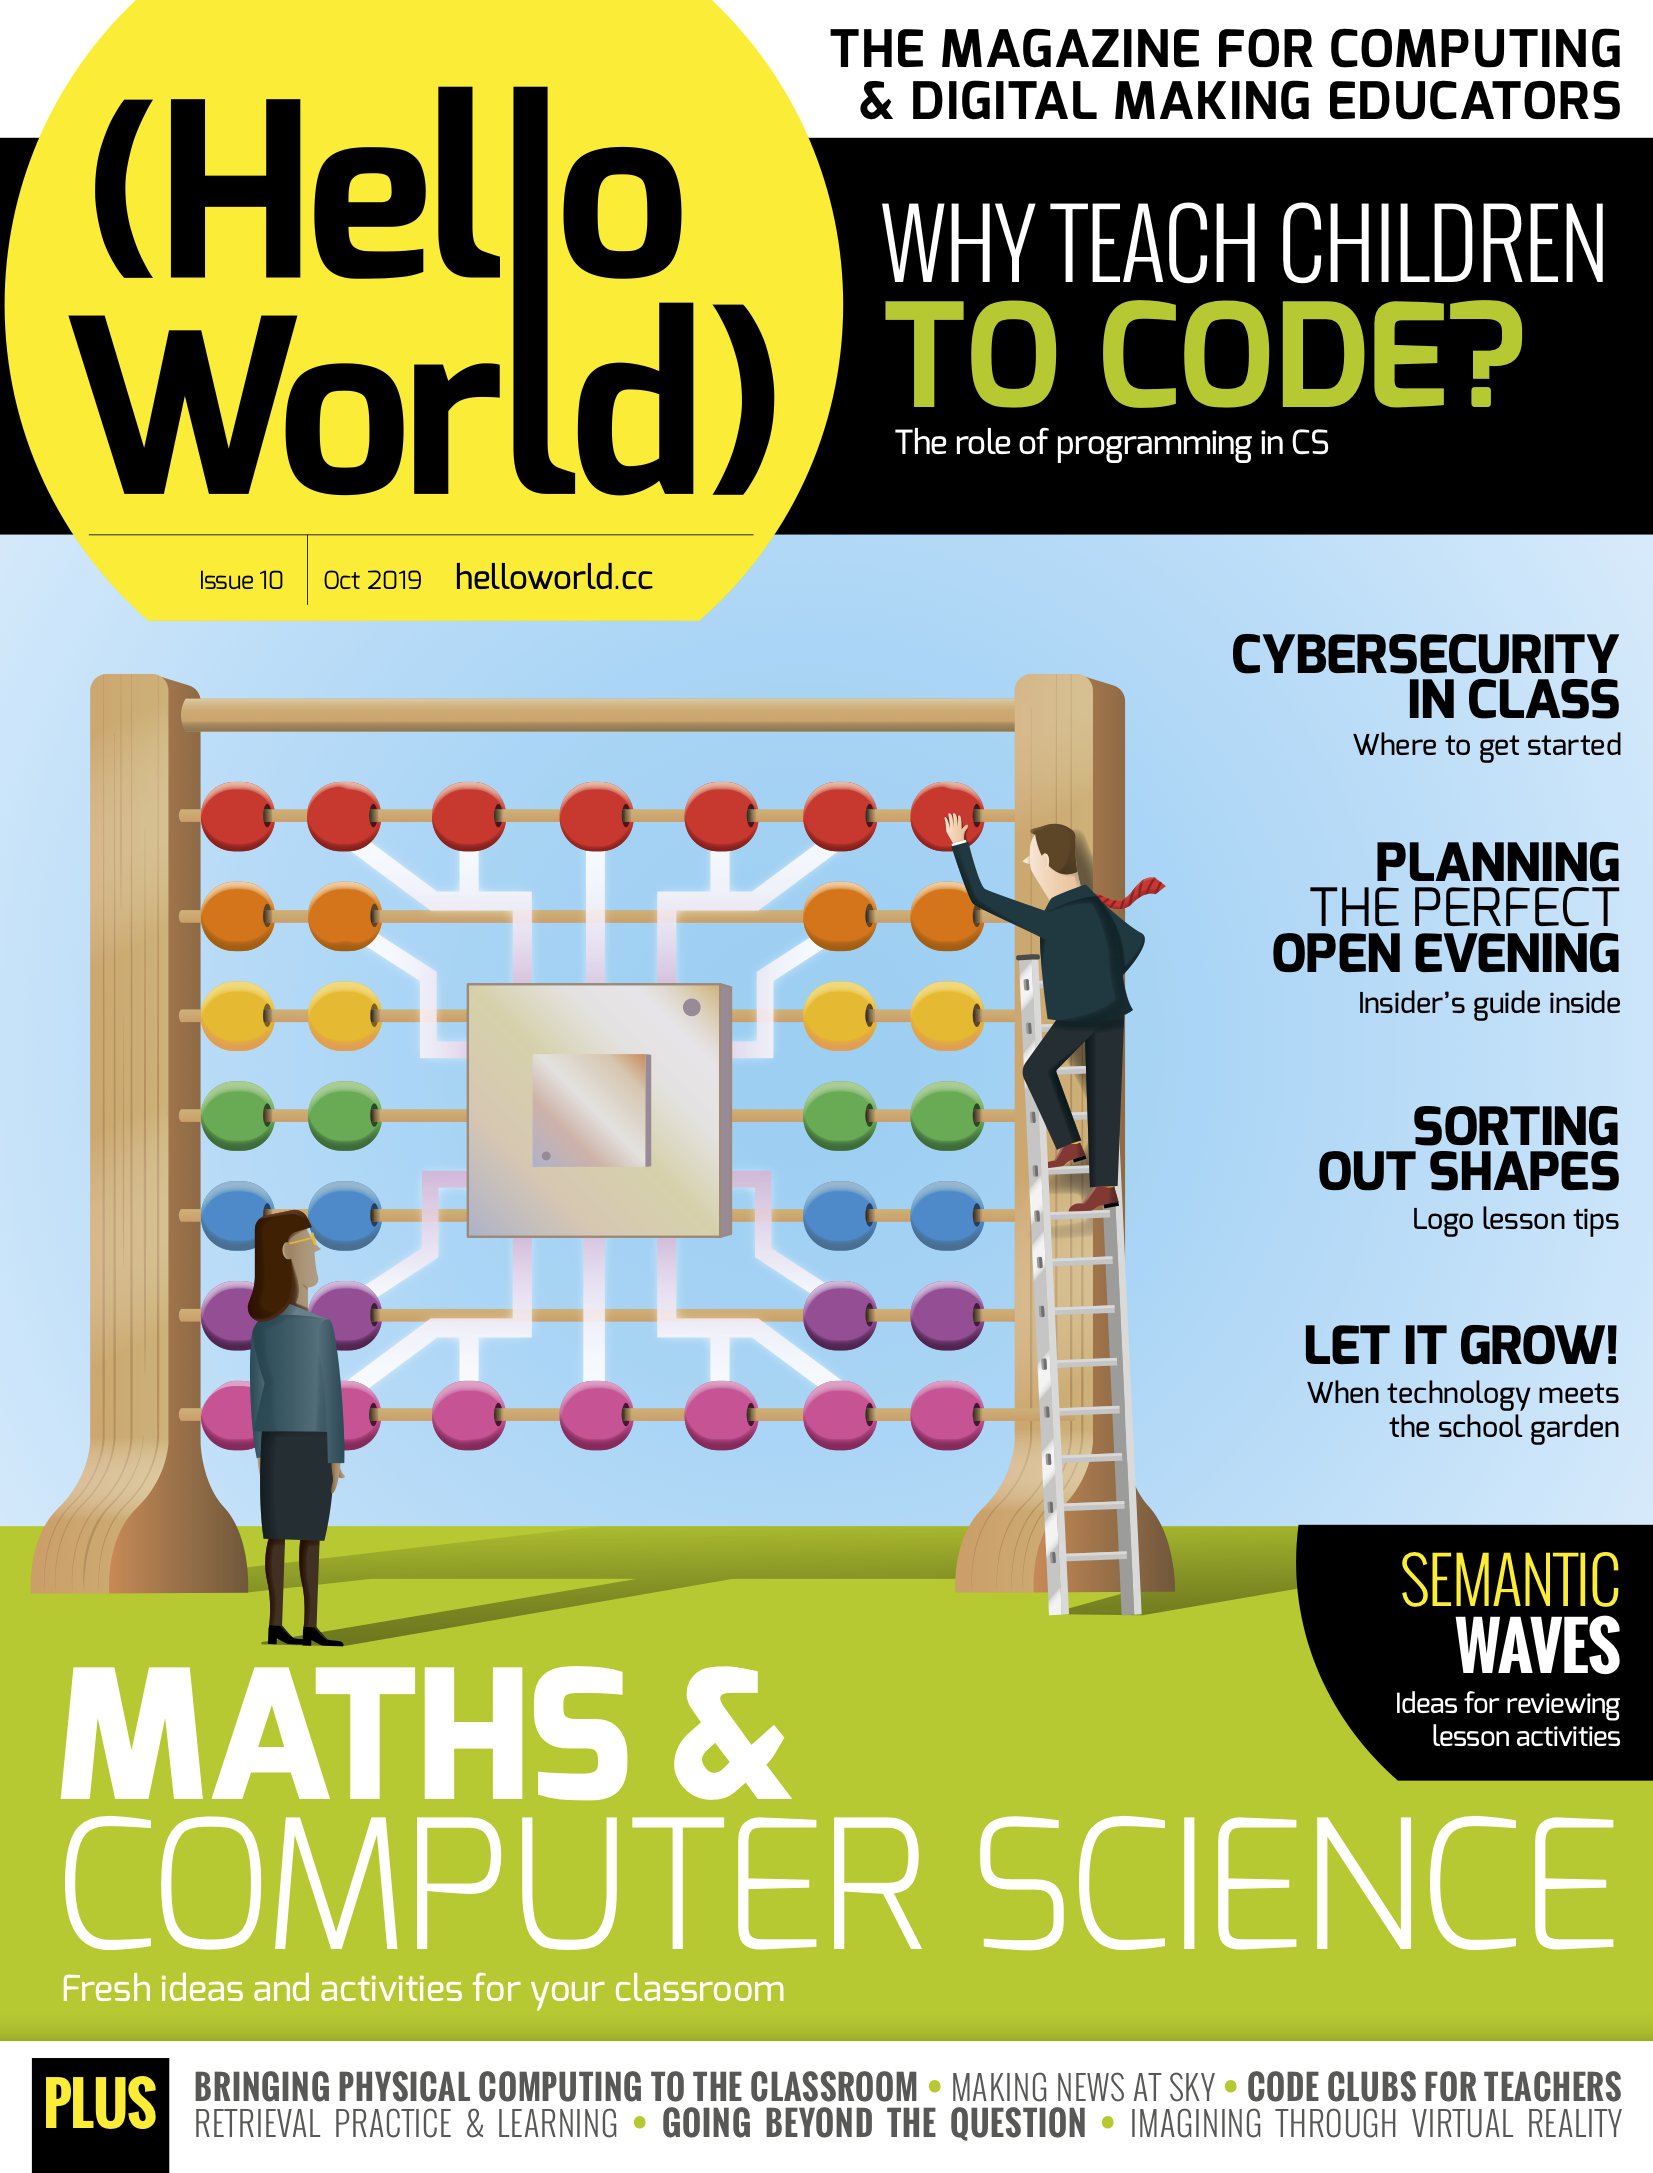
Hello World issue 10
Issue 10 of Hello World magazine is out today, and it’s free. 100% free.
Click here to download the PDF right now. Right this second. If you want to be a love, click here to subscribe, again for free. Subscribers will receive an email when the latest issue is out, and we won’t use your details for anything nasty.
If you’re an educator in the UK, click here and you’ll receive the printed version of Hello World direct to your door. And, guess what? Yup, that’s free too!
What I’m trying to say here is that there is a group of hard-working, passionate educators who take the time to write incredible content for Hello World, for free, and you would be doing them (and us, and your students, kids and/or friends) a solid by reading it 🙂
Website: LINK
Schreibe einen Kommentar
Du musst angemeldet sein, um einen Kommentar abzugeben.