Schlagwort: Weather Station
-

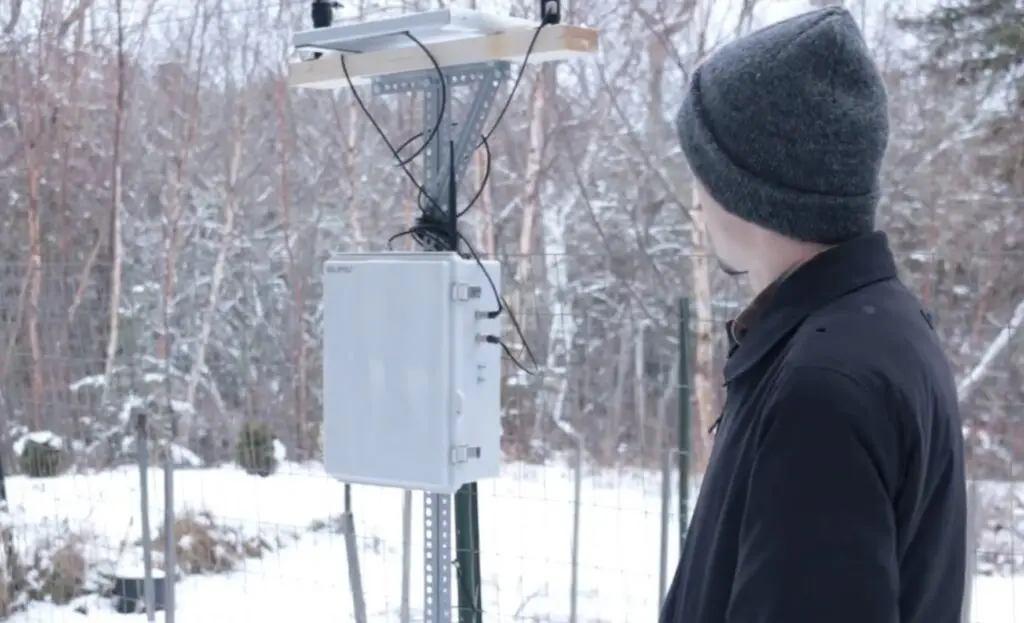
A DIY weather display with dedicated outdoor sensor station
Reading Time: 2 minutesWeather stations are popular projects in the maker community because they’re useful and usually quite affordable to construct. But most that we see are really weather information displays that gather data through the internet from stations in the region. That data is fairly accurate, but there can be minor differences due to microclimate zones.…
-

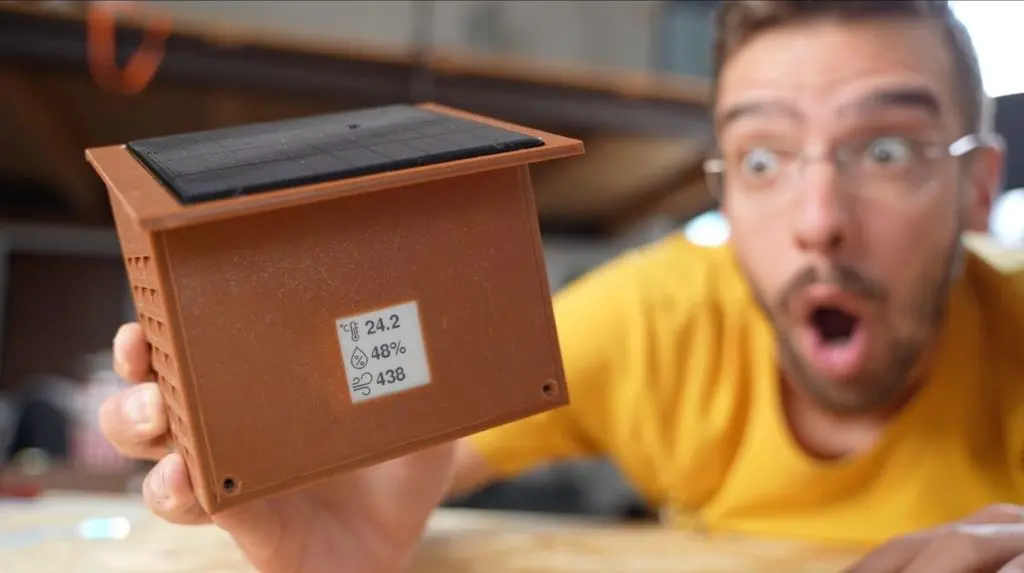
Celebrating Earth Day with a solar-powered E Ink weather station
Reading Time: 2 minutesThe world just recognized Earth Day and it was a good reminder that we all have a responsibility to protect the planet. Unfortunately, many of our devices suck up energy in direct opposition to that goal. But the market has proven that we aren’t willing to sacrifice convenience. Luckily, that isn’t always…
-

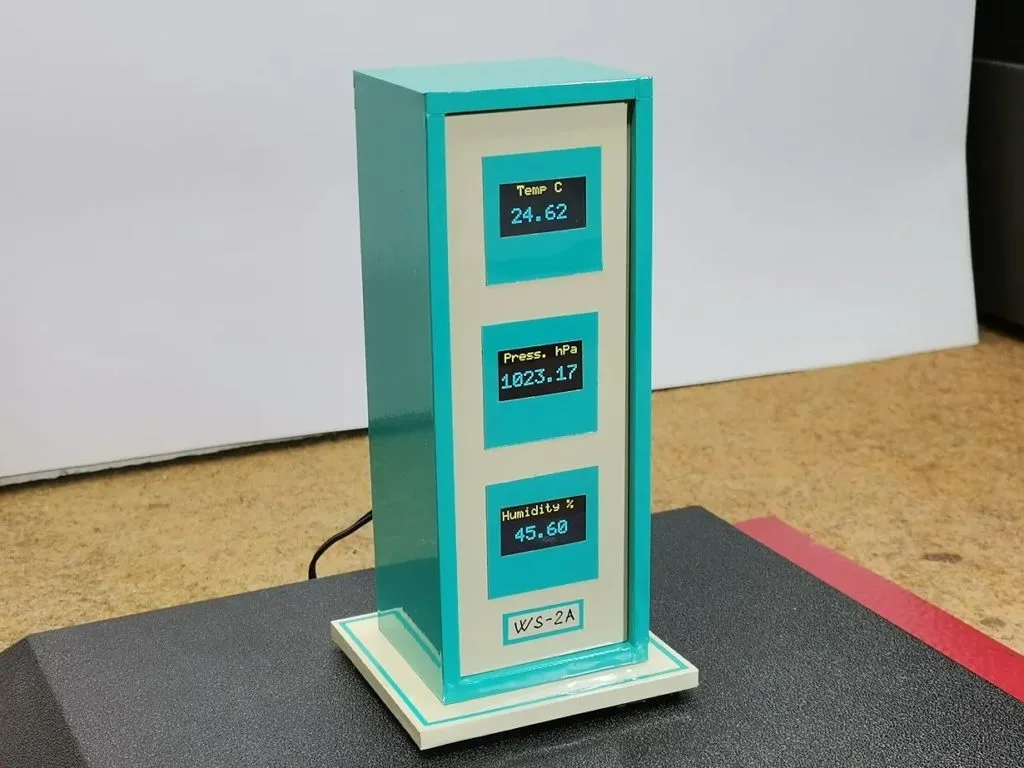
This classic weather station prioritizes the essentials
Reading Time: 2 minutesWeather stations are very popular projects for people new to Arduino. They’re complex enough to help a person learn new skills, but they’re simple enough to be approachable. However, that popularity has led to something of an arms race, with many makers attempting to design the most impressive weather stations on the…
-

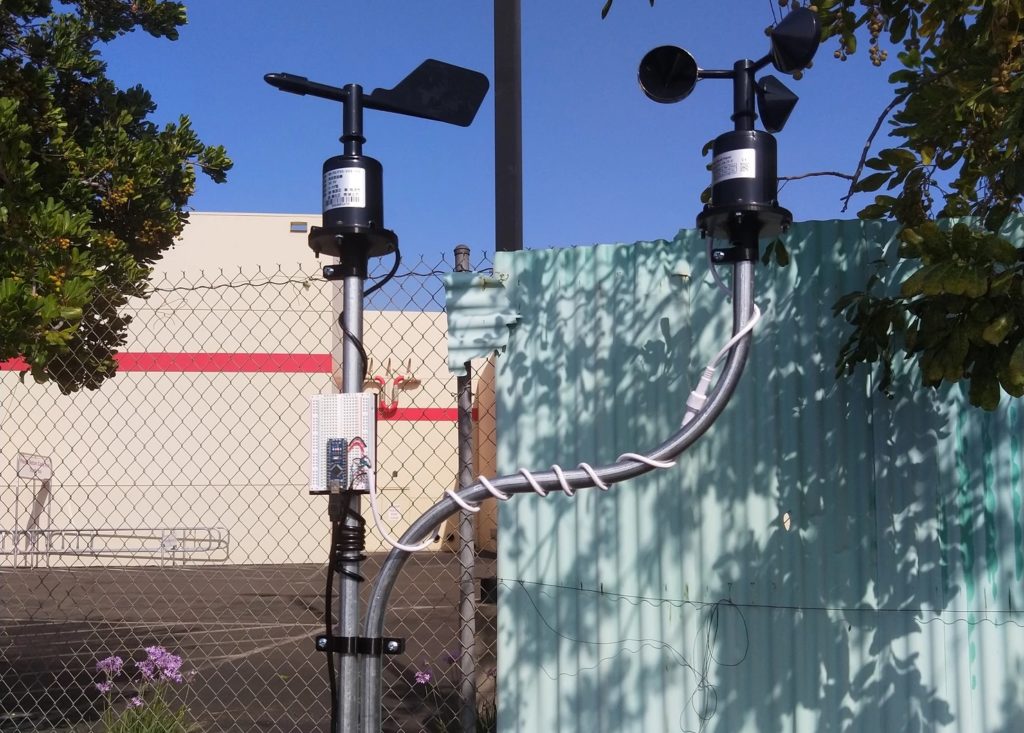
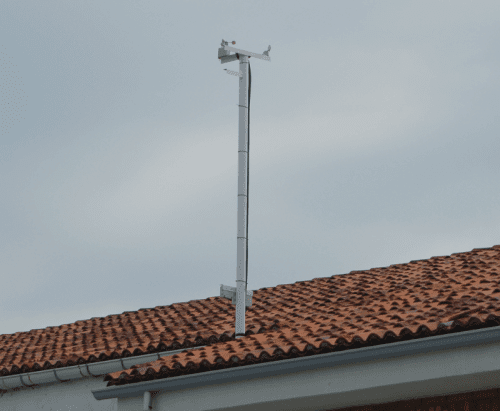
Continuously measure wind speed and direction with this EMT conduit-mounted station
Reading Time: 2 minutesArduino Team — May 17th, 2022 It seems like DIY weather stations are everywhere, and while most can perform the basic functions of measuring temperature, humidity, and air pressure, the majority are still unable to determine wind speed and direction. In response, Austin Allen from Elation Sports Technologies LLC created his own system that…
-

Citizen science traffic monitoring with Raspberry Pi
Reading Time: 2 minutesHomes in Madrid, Dublin, Cardiff, Ljubljana, and Leuven are participating in the Citizens Observing UrbaN Transport (WeCount) project, a European Commission–funded research project investigating sustainable economic growth. 1,500 Raspberry Pi traffic sensors will be distributed to homes in the five cities to gather data on traffic conditions. Every hour, the devices will…
-

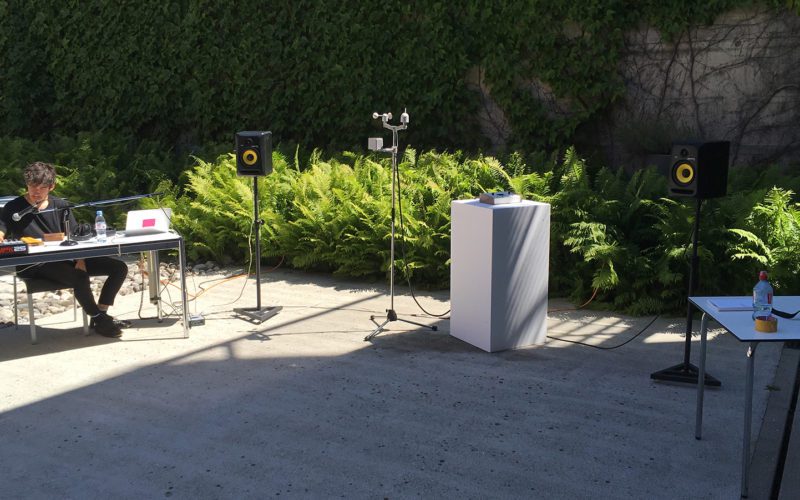
Custom weather station enhances and modifies electronic music
Reading Time: 2 minutesCustom weather station enhances and modifies electronic music Arduino Team — October 25th, 2018 While the environment is important for any musical performance, generally it’s not an active part of the show. Adrien Kaeser, though, has come up with a device called the “Weather Thingy“ that integrates climate-related events directly into electronic…
-

MagPi 71: Run Android on Raspberry Pi
Reading Time: 3 minutesHey folks, Rob here with good news about the latest edition of The MagPi! Issue 71, out right now, is all about running Android on Raspberry Pi with the help of emteria.OS and Android Things. Android and Raspberry Pi, two great tastes that go great together! Android and Raspberry Pi A big…
-

Tackling climate change and helping the community
Reading Time: 3 minutesIn today’s guest post, seventh-grade students Evan Callas, Will Ross, Tyler Fallon, and Kyle Fugate share their story of using the Raspberry Pi Oracle Weather Station in their Innovation Lab class, headed by Raspberry Pi Certified Educator Chris Aviles. United Nations Sustainable Goals The past couple of weeks in our Innovation Lab…
-

2017 Weather Station round-up
Reading Time: 3 minutesAs we head into 2018 and start looking forward to longer days in the Northern hemisphere, I thought I’d take a look back at last year’s weather using data from Raspberry Pi Oracle Weather Stations. One of the great things about the kit is that as well as uploading all its readings…
-

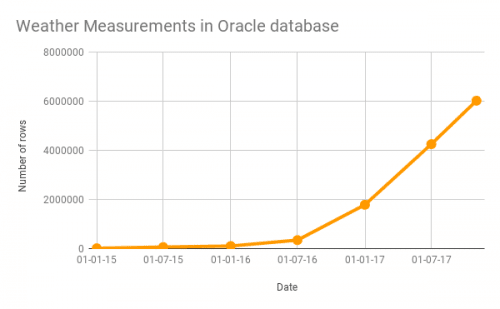
Visualising Weather Station data with Initial State
Reading Time: 3 minutesSince we launched the Oracle Weather Station project, we’ve collected more than six million records from our network of stations at schools and colleges around the world. Each one of these records contains data from ten separate sensors — that’s over 60 million individual weather measurements! Weather station measurements in Oracle database…