When imagining motion sensors, devices such as accelerometers, infrared detectors, and LiDAR units probably come to mind. But due to the complexity and oftentimes high costs of these parts, researchers Joseph Liew and Keng Wei Ng from the National University of Singapore wanted to create a lower-cost and easier-to-assemble alternative. Their solution, called ESsense, uses the electrostatic properties of objects to sense motion.
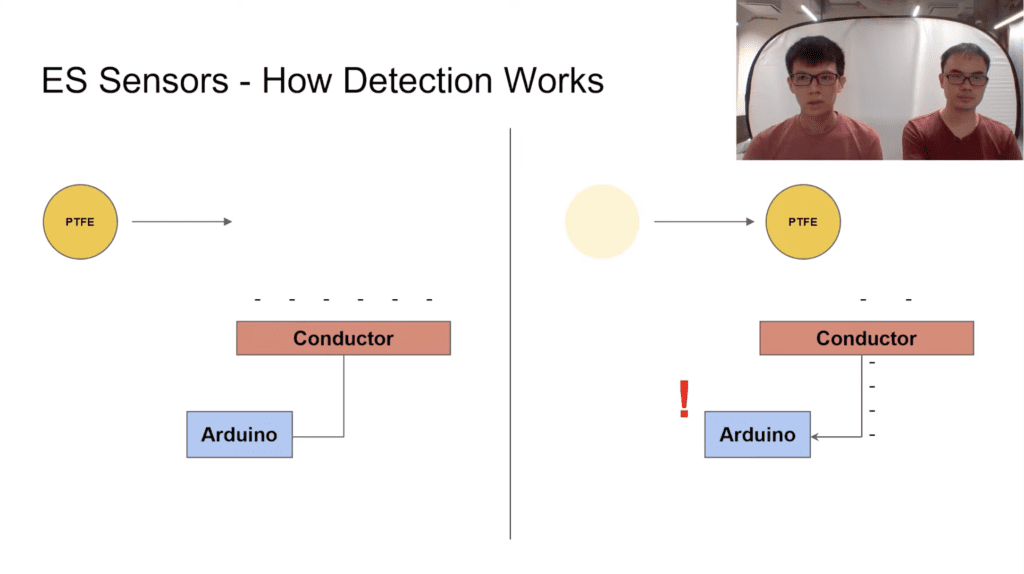
At the core of the product, ESsense relies on a pair of materials and an Arduino. The first material is a dielelectric that carries a static charge, whereas the second is a stationary conductive material such as a copper pad. The movement of the former near the surface of the latter causes a current to be induced, which can then be read by the connected microcontroller. Lower humidity levels are greatly preferred since they allow the air to more effectively transfer a charge, but for higher ones, the team created a small PCB-mounted circuit that boosts the signal via an amplifier.
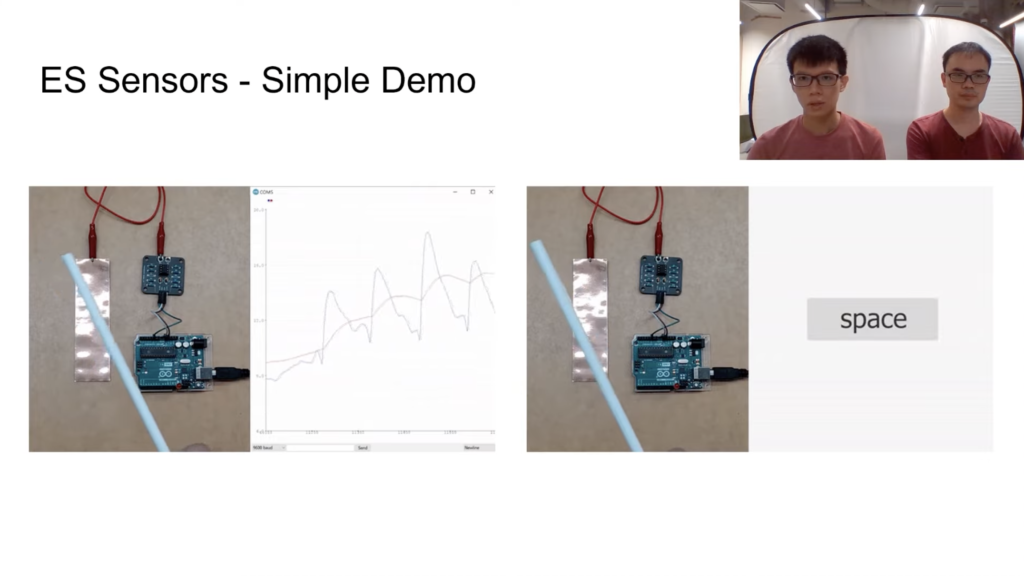
With the basic sensor now working, the final step was to come up with creative ways to implement contactless motion sensors that use ESsense. One creation involved a pair of gates that detect when an object has gone past both detectors. By subtracting the time difference, speed and direction can be determined. They also designed two basic games that take advantage of the direction-sensing capabilities of the device.
For more information about ESsense, you can watch the team’s CHI ’22 presentation below!
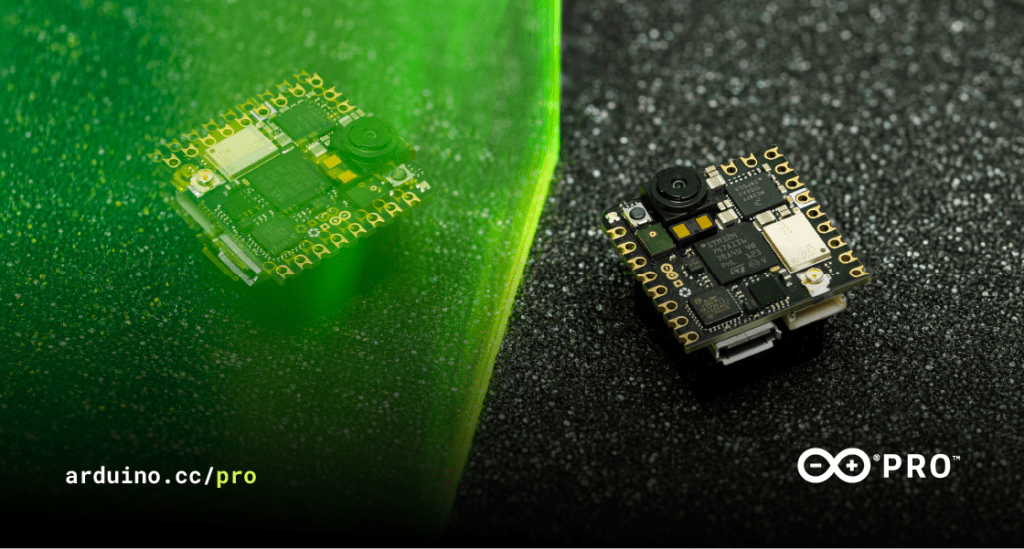
We’re proud to announce a new addition to the Arduino ecosystem, the Nicla Vision.
This is a brand new, ready-to-use, 2MP standalone camera that lets you analyze and process images on the edge for advanced machine vision and edge computing applications.
Now you can add image detection, facial recognition, automated optical inspection, vehicle plate reading, gesture recognition and more to your projects. Nicla Vision has a powerful dual processor and is packed with features that make an infinite number of applications possible in building and industrial automation, safety and security, and prototyping. Everything from business-savvy predictive maintenance (by detecting and analyzing surface wear, for example) to user-friendly smart kiosks that anyone can explore via intuitive gestures. All true to Nicla’s mission to provide a new range of easy-to-use, cost-effective and accessible tools to advanced users and enthusiasts alike.
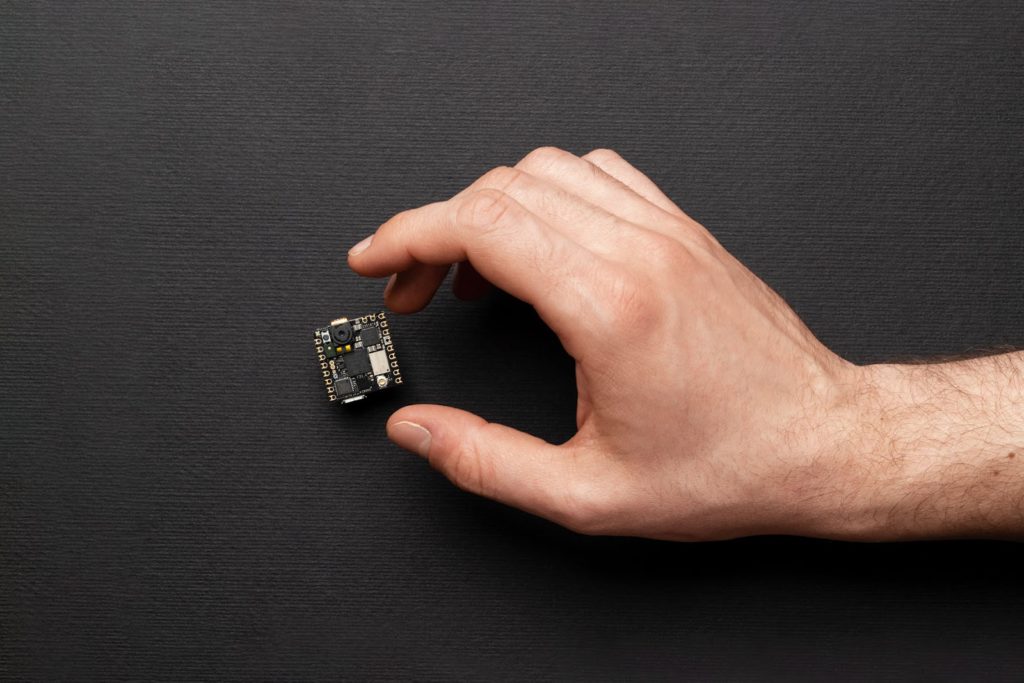
Packed with potential, you can use Nicla Vision anywhere because it’s small in size and can be battery-powered. At the far end of your construction site, or in a tight spot in front of analog meters, it works wherever it’s needed.
What’s more, Nicla Vision is compatible with Portenta and MKR components. It fully integrates with OpenMV, supports MicroPython and features WiFi and Bluetooth® Low Energy connectivity to complement a wide range of professional and consumer equipment. This means you can easily add ready-to-use sensors such as a camera, microphone, IMU and ToL to your projects.
Prototyping machine vision applications just got a lot faster.
Nicla Vision Features
Part of the Nicla range alongside the Nicla Sense ME, it’s based on Arduino’s smallest form factor at just 22.86 x 22.86 mm.
It has a powerful dual core microcontroller and is equipped with a 2MP color camera that supports tinyML, taking image processing capabilities to the next level.
Nicla Vision offers both WiFi and Bluetooth® Low Energy connectivity.
On top of image detection and recognition, it senses and captures distance, sound, movement and vibration data, thanks to a smart six-axis motion sensor, integrated microphone and distance sensor.
It maximizes compatibility: all Nicla products also fit perfectly into any solution based on Portenta or MKR.
Need a standalone solution? Nicla Vision can be battery-powered.
Whether in a dark warehouse or on the other side of your house, the Nicla Vision has the abilities and intelligence to keep an eye on things for you. If you’ve ever dreamed about interacting with machines that simply understand what you need because they can see you, this device is for you.
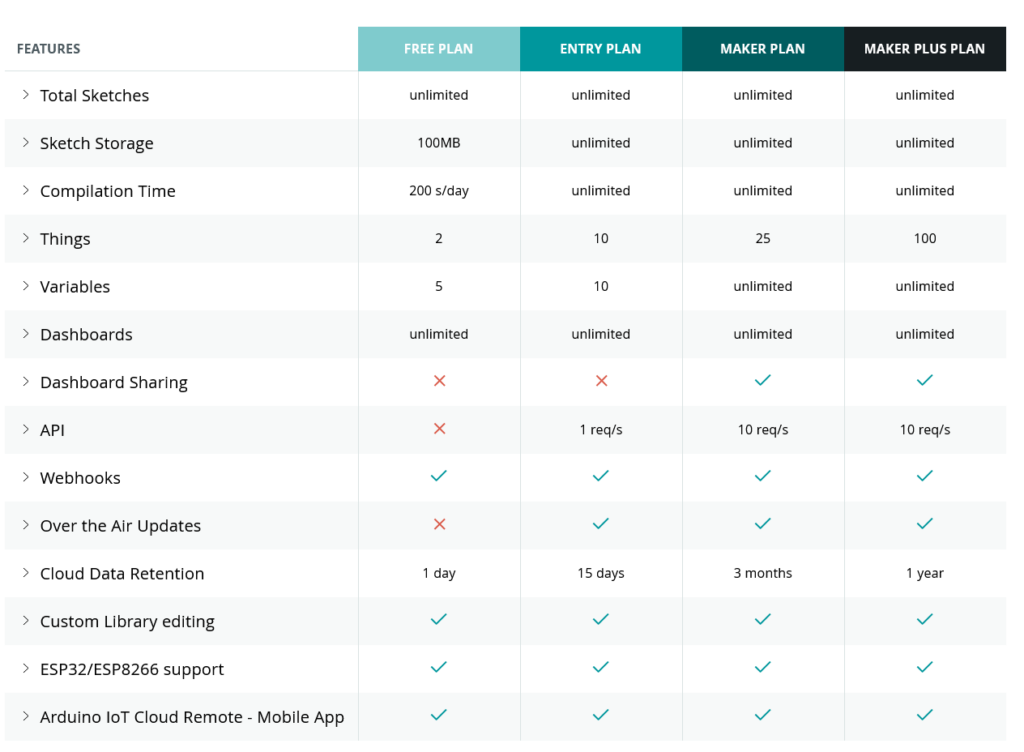
Historical data can be essential to making your electronics and Arduino project work how you want them to. Data retention is one of the features that changes depending on which level of Arduino Cloud account you have. Here’s everything you need to know, so you can choose exactly the right Arduino Cloud plan.
Hang on though. Aren’t we here to talk about data retention?
Indeed we are. When we say “variables”, this is the term used to describe the data you send to your Arduino Cloud. It sounds a bit technical, but consider the word. “Variable” actually makes more sense than “data”, which is kinda woolly.
Variables are information that changes or, you guessed it, varies. Temperature, for example. If you have a temperature sensor sending data to the Cloud, it’s a variable. Because the value of the data (the temperature) is always changing/varying.
So in your sketch it’s known as a variable. The different data retention options in the Arduino Cloud plans tell you how long the Cloud will store a record of those variables for you.
Historical Data Options
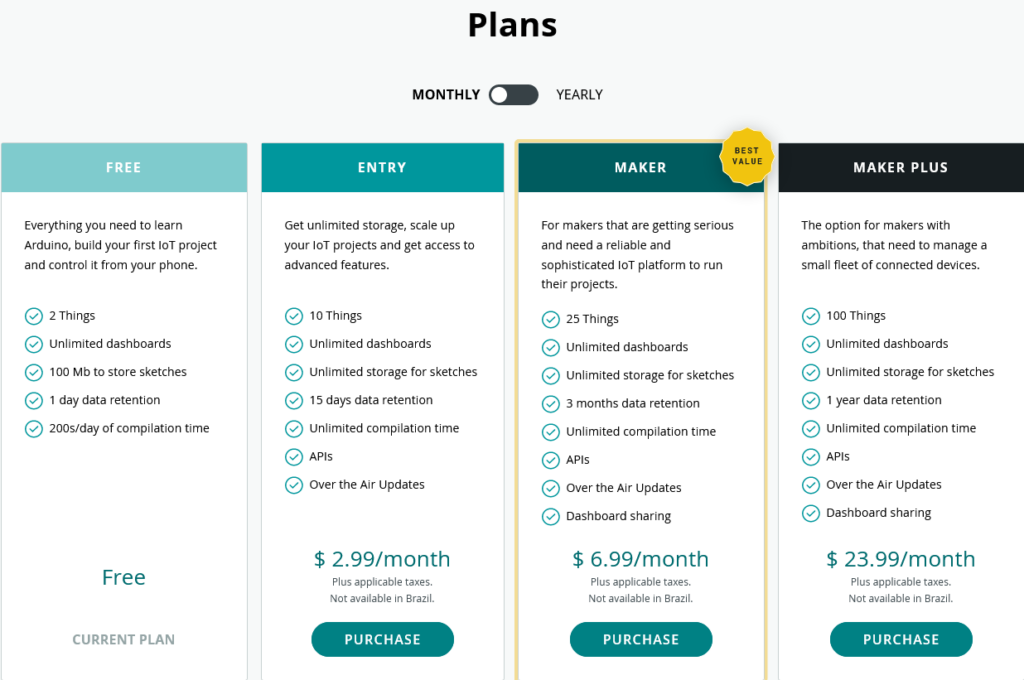
Each Arduino Cloud plan offers a different length of time for how long you retain sensor data, depending on your needs.
If you’re running a home automation to turn the lights on when it drops dark, your system is working with (pretty much) real-time data. So 24 hours of sensor information is perfectly adequate. It’s not like you’ll be turning a lamp on or off based on yesterday’s ambient light levels.
A weather station might work a bit differently though. If you’re measuring the temperature or rainfall or daylight hours, you may want to build a comparison to see how the weather is changing. In this case, an Arduino Cloud Entry plan would give you 15 days of data, allowing you to monitor and record recent changes in your weather station’s variables.
Historical data for an IoT greenhouse, or maybe an aquarium or terrarium, would be much more important. Maybe it’s even an industrial project that’s monitoring equipment for predictive maintenance needs. In these cases, being able to look back at your variables over previous weeks and months could be essential. In that case, you’d go Maker or Maker Plus, so you can build dashboards with detailed histories of your measurements.
It’s very possible that you don’t even know how much historical data will be useful to your project at first. You start on the free tier, decide that it’d be useful to have legacy information, and go up through the Entry plan and eventually settle on Maker. The project leads the way, until it’s delivering everything you need.
Putting Historical Data to Use in Arduino Cloud
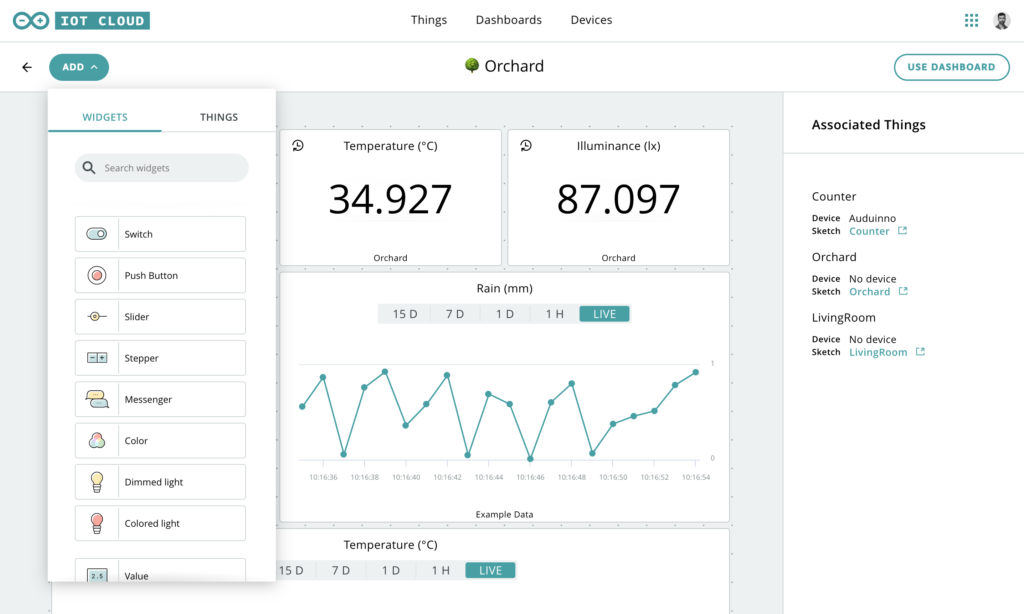
Arduino Cloud is really clever when it comes to the data generated by sensors and used as variables. For example, you can specify how often new data is sent to your Arduino Cloud.
Let’s say you’re monitoring Wi-Fi signal strength at the bottom of the garden, where a project (weather station, let’s say) is installed. If this is a solar and/or battery powered device, power consumption becomes essential. By changing the data sampling interval from updating a variable on Arduino Cloud every second to updating once a minute, you can extend battery life by a huge amount. The device is only operating a fraction of the time it was before, and the information is just as useful.
Combined with 15 days or three months of historical data, you can build a detailed picture of Wi-Fi performance that lets you keep everything running perfectly. Or, if you need to find out when and why your signal has been dropping, the story is right there in your Arduino Cloud dashboard.
Choosing the Right Arduino Cloud Plan
So for all these reasons, you can see why different amounts of data retention are available in the Arduino Cloud plans. It’s not that all projects benefit from as much retention as possible. As we discussed, even some complex, elaborate projects barely need any. Others, which might be simple signal strength monitoring or rainfall measurement, need to know what was happening months ago.
You have the choice, because the different Arduino Cloud plans offer different historical data options for different needs. If in doubt for what your project needs to work as intended, start on the free plan and work up from there.
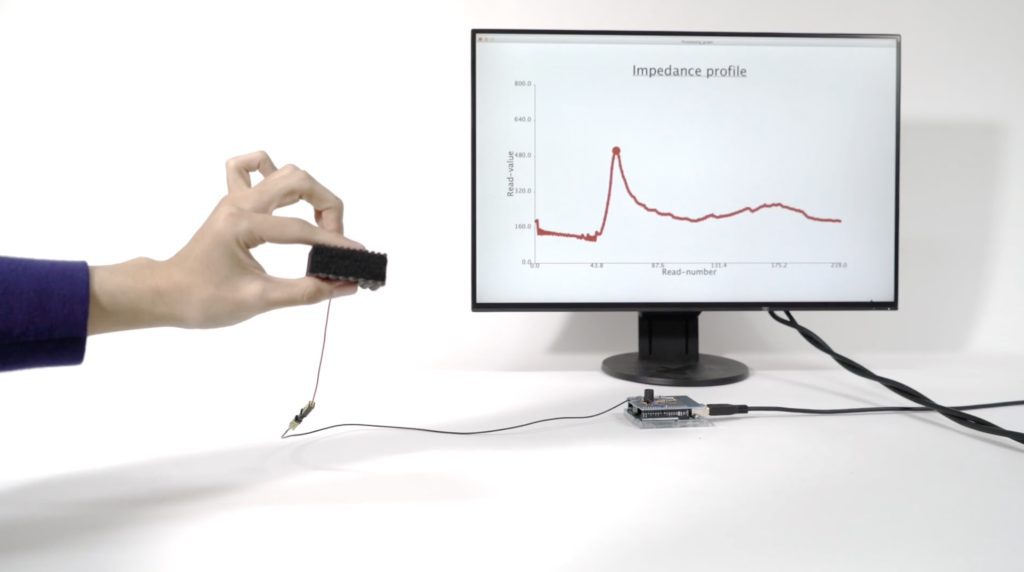
The field of soft tactile sensors is fascinating, as they grant robots the ability to move more freely or have greater granularity. Soft sensors also allow for human-computer interfaces to feel more interactive. However, previous sensors like these required multiple devices or complex wiring, making them difficult to use. To address these challenges, researchers from the University of Tokyo and Mercari R4D were able to come up with a way to integrate touch-sensitive pads onto a piece of foam, which they call “foamin.”
Foamin consists of a small piece of foam that has a series of conductive rows on its surface. These strips are separated by air, which is an insulator, thus creating a capacitor. When a human’s finger glides across, both the capacitance of the overall circuit and the resistance change. This impedance is measured by a single wire with an Arduino Uno, and after some data filtering, the team had a set of 60 data points per gesture. They then trained a model with this data and were able to achieve an accuracy of 100% when a mesh shield was attached.
This system is amazing for a whole host of possible applications. The researchers suggested using foamin as a musical instrument (similar to a launchpad), a numeric keypad, and even as a smart cushion to sense which posture the sitter is currently in.
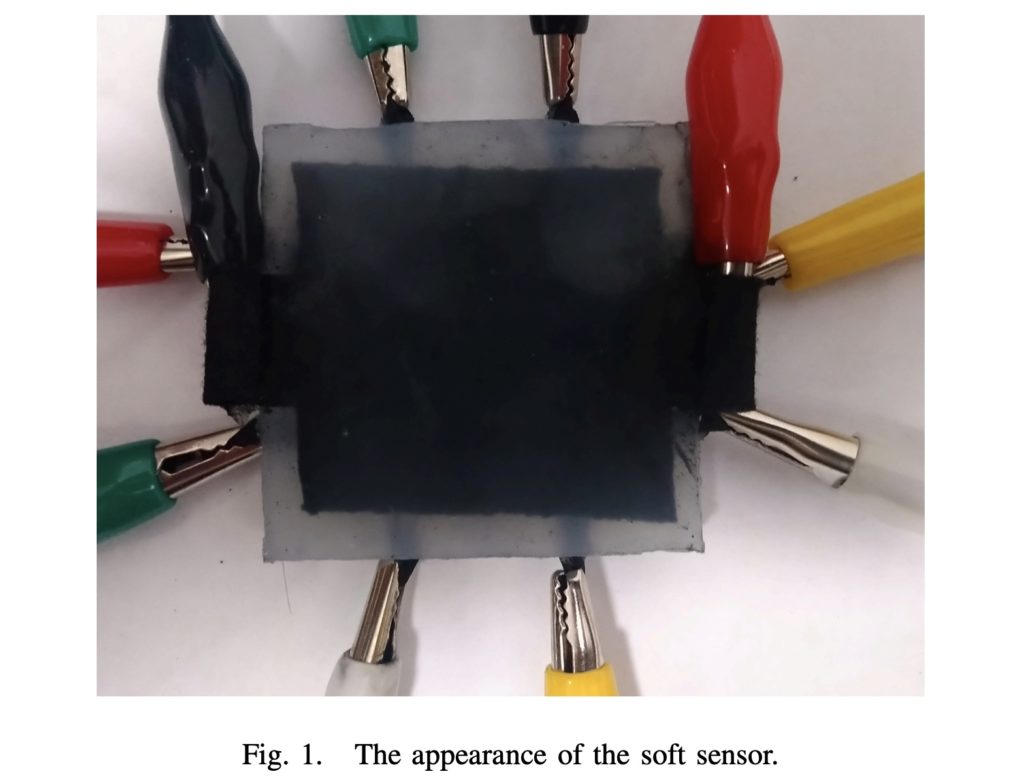
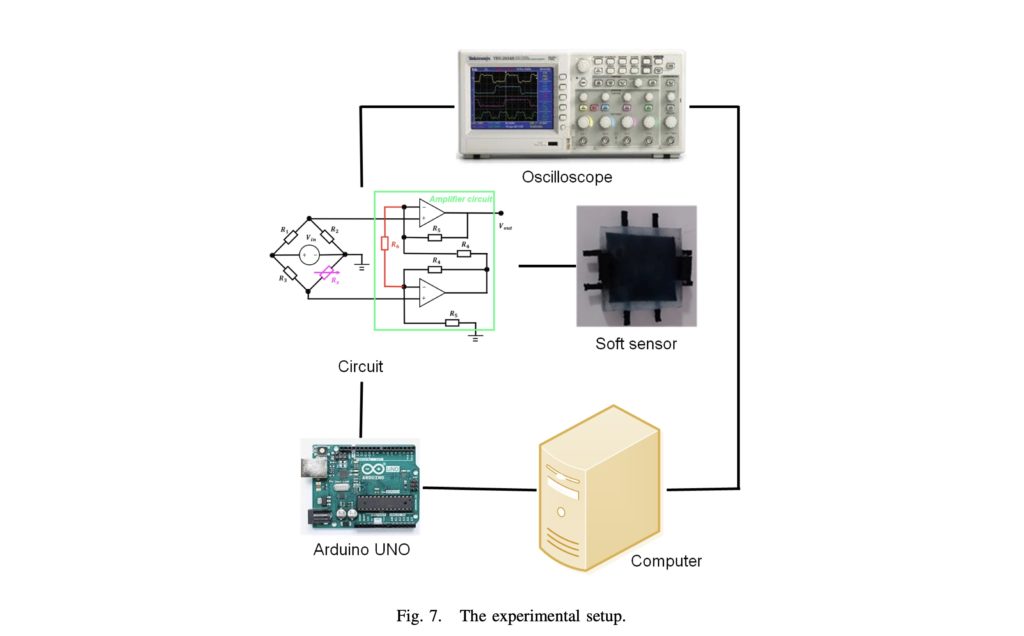
Robots are often filled with a myriad of different sensors but being able to detect touch is still fairly tough. This is primarily due to needing a large sensing area, flexible surfaces, and usually having complex circuitry. Imagine a robotic gripper that uses several “fingers” to lift and manipulate produce, or a humanoid that can respond to feedback on its hands. Other technologies such as capacitive and vision sensors have been tried in the past, but both use complicated and expensive components. A team at the Department of Mechanical Engineering at UC Berkeley was able to engineer a solution to this problem by utilizing a novel combination a two-layer structure. The first layer is a conductive fabric that is responsible for sensing the contact force, whereas the second layer of four rubber elements senses where the touch took place.
On its own, the resulting signal is quite noisy, so the researchers used an Arduino to read in the raw analog data, filter it, and then send it to a computer for extra processing. Once this was done, a machine learning regression model was created to fine-tune the detection capabilities.
To test their device, the team placed weights of varying sizes on each corner to simulate a touch. As seen in the graphs below, the system is already quite accurate, and with more training it can become even better over time.
10 most popular modules and sensors for the Arduino UNO all on one board
Arduino Team — December 1st, 2020
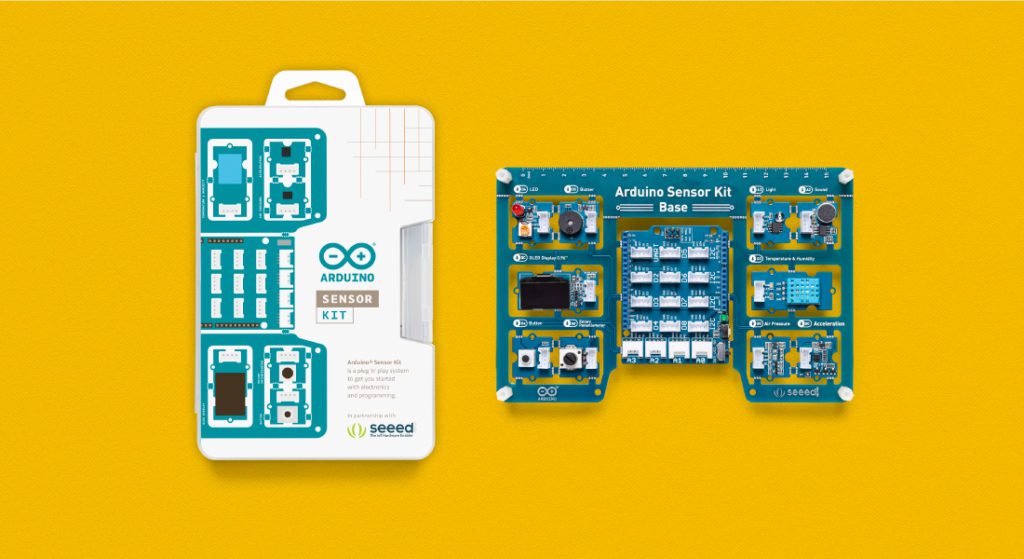
Getting started with electronics and sensing the world around you is now easier than ever with the new all-in-one Arduino Sensor Kit from Arduino, in partnership with Seeed.
The 10 most popular modules and sensors for your Arduino UNO have been integrated onto a single board, providing plug-and-play convenience without the need for any soldering or wiring! Combining basic Grove sensors and actuators for the Arduino UNO, the kit contains a base shield featuring the following modules that can be connected either through the digital, analog, or I2C connectors:
An OLED screen
4 digital modules (LED, button, buzzer and potentiometer)
5 sensors (light, sound, air pressure, temperature, and accelerometer)
Just plug the Arduino Sensor Kit into the Arduino UNO, then you’re ready to follow the Plug, Sketch & Play online lessons that make getting started a breeze.
The kit is equipped with 16 Grove connectors, which when placed on the board, offer functionality to the various pins. With seven digital connections, four analog connections, four I2C connections, and a UART connection, the base shield can be easily mounted onto an Arduino UNO board and programmed through the Arduino IDE.
Now available from the Arduino Store, the Arduino Sensor Kit comes as a standalone kit for only €23.00 / US$23.00, or can be purchased with the Arduino UNO Rev3 board as a great value bundle for €38.70 / US$38.70. For more details, check out our website here.
This aerial system launches Nano 33 BLE Sense darts for data collection
Arduino Team — October 29th, 2020
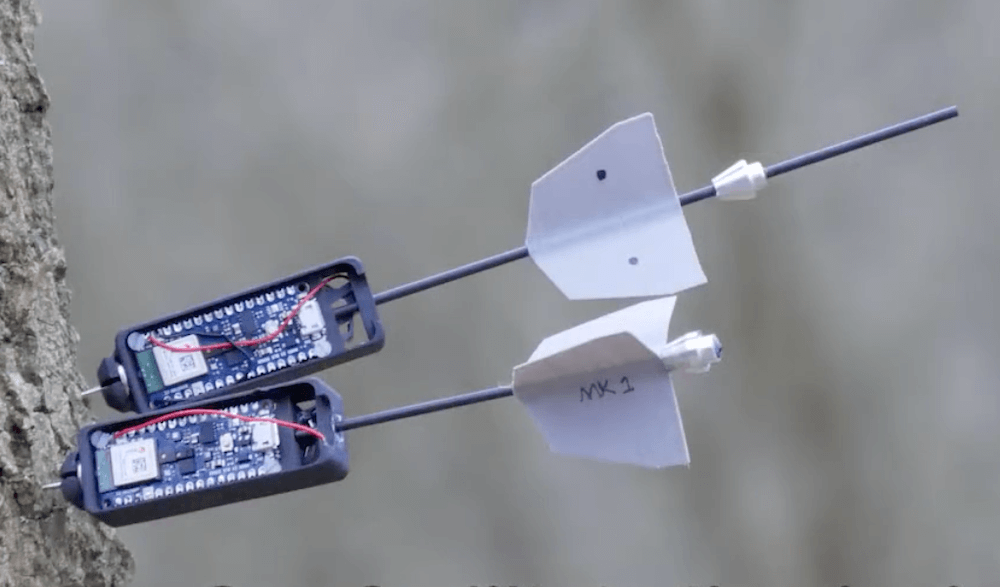
Sensor deployment via unmanned aerial vehicles is an interesting concept. Up until now, you’ve had two options: use a drone that drops sensors onto the ground, or one with some kind of manipulator to stick them in particular place. However, researchers at Imperial College London have been studying a third approach, which shoots sensor pods from an aerial platform like darts.
The system utilizes a compressed spring, along with a shape-memory alloy (SMA) trigger to fling the sensor pods at a nearby surface, at up to a four-meter range. The actual sensor package used here is an Arduino Nano 33 BLE Sense, allowing for a variety of measurements without extra hardware in hazardous environments or inaccessible locations.
Several methods of attachment were proposed, including magnets and chemical bonding, but the experiment’s research paper focuses on dart-like wood attachment, since this would require the most force.
More details on the project can be found on IEEE Spectrum and in the video below.
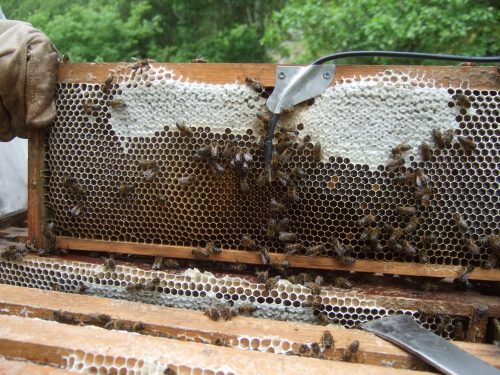
Keeping an eye on bee life cycles is a brilliant example of how Raspberry Pi sensors help us understand the world around us, says Rosie Hattersley
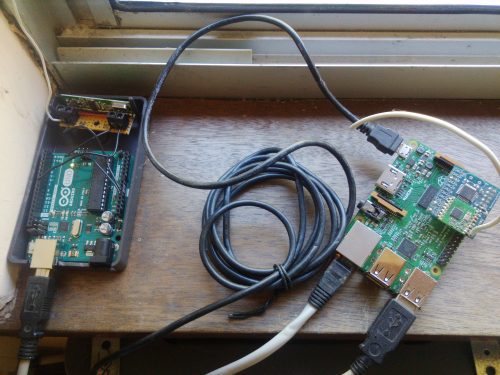
The setup featuring an Arduino, RF receiver, USB cable and Raspberry Pi
Getting to design and build things for a living sounds like a dream job, especially if it also involves Raspberry Pi and wildlife. Glyn Hudson has always enjoyed making things and set up a company manufacturing open-source energy monitoring tools shortly after graduating from university. With access to several hives at his keen apiarist parents’ garden in Snowdonia, Glyn set up BeeMonitor using some of the tools he used at work to track the beehives’ inhabitants.
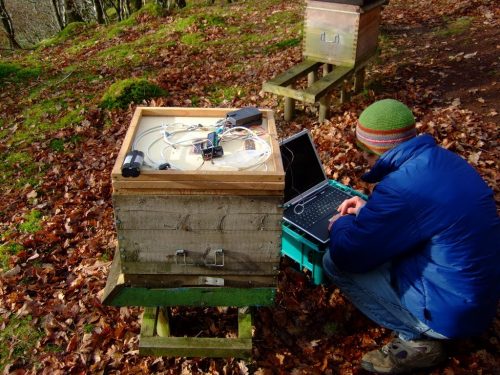
Glyn checking the original BeeMonitor setup
“The aim of the project was to put together a system to monitor the health of a bee colony by monitoring the temperature and humidity inside and outside the hive over multiple years,” explains Glyn. “Bees need all the help and love they can get at the moment and without them pollinating our plants, weíd struggle to grow crops. They maintain a 34∞C core brood temperature (± 0.5∞C) even when the ambient temperature drops below freezing. Maintaining this temperature when a brood is present is a key indicator of colony health.”
Wi-Fi not spot
BeeMonitor has been tracking the hives’ population since 2012 and is one of the earliest examples of a Raspberry Pi project. Glyn built most of the parts for BeeMonitor himself. Open-source software developed for the OpenEnergyMonitor project provides a data-logging and graphing platform that can be viewed online.
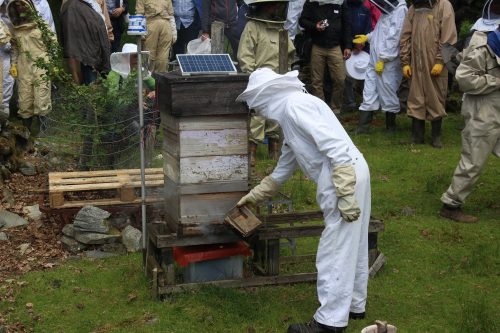
BeeMonitor complete with solar panel to power it. The Snowdonia bees produce 12 to 15 kg of honey per year
The hives were too far from the house for WiFi to reach, so Glyn used a low-power RF sensor connected to an Arduino which was placed inside the hive to take readings. These were received by a Raspberry Pi connected to the internet.
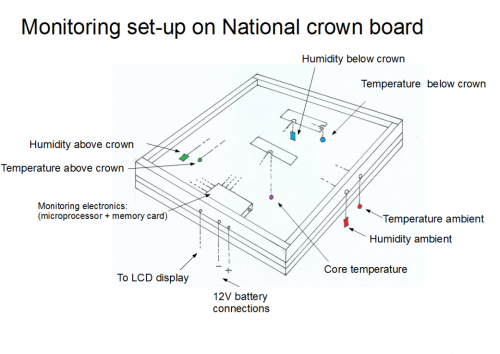
Diagram showing what information BeeMonitor is trying to establish
At first, there was both a DS18B20 temperature sensor and a DHT22 humidity sensor inside the beehive, along with the Arduino (setup info can be found here). Data from these was saved to an SD card, the obvious drawback being that this didn’t display real-time data readings. In his initial setup, Glyn also had to extract and analyse the CSV data himself. “This was very time-consuming but did result in some interesting data,” he says.
Sensor-y overload
Almost as soon as BeeMonitor was running successfully, Glyn realised he wanted to make the data live on the internet. This would enable him to view live beehive data from anywhere and also allow other people to engage in the data.
“This is when Raspberry Pi came into its own,” he says. He also decided to drop the DHT22 humidity sensor. “It used a lot of power and the bees didn’t like it – they kept covering the sensor in wax! Oddly, the bees don’t seem to mind the DS218B20 temperature sensor, presumably since it’s a round metal object compared to the plastic grille of the DHT22,” notes Glyn.
Unlike the humidity sensor, the bees don’t seem to mind the temperature probe
The system has been running for eight years with minimal intervention and is powered by an old car battery and a small solar PV panel. Running costs are negligible: “Raspberry Pi is perfect for getting projects like this up and running quickly and reliably using very little power,” says Glyn. He chose it because of the community behind the hardware. “That was one of Raspberry Pi’s greatest assets and what attracted me to the platform, as well as the competitive price point!” The whole setup cost him about £50.
Glyn tells us we could set up a basic monitor using Raspberry Pi, a DS28B20 temperature sensor, a battery pack, and a solar panel.
Pick colors from real things with this portable tool
Arduino Team — January 14th, 2020
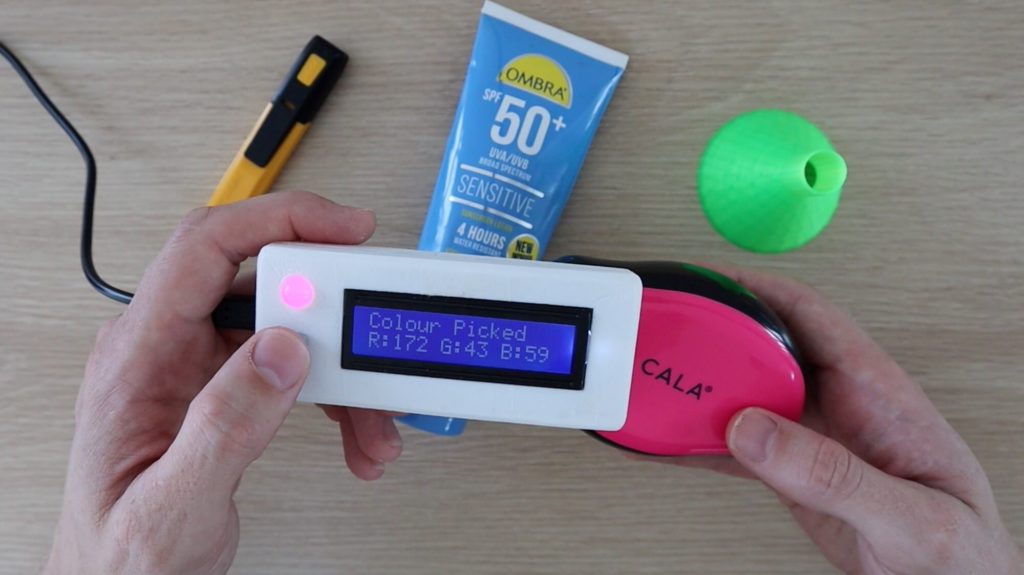
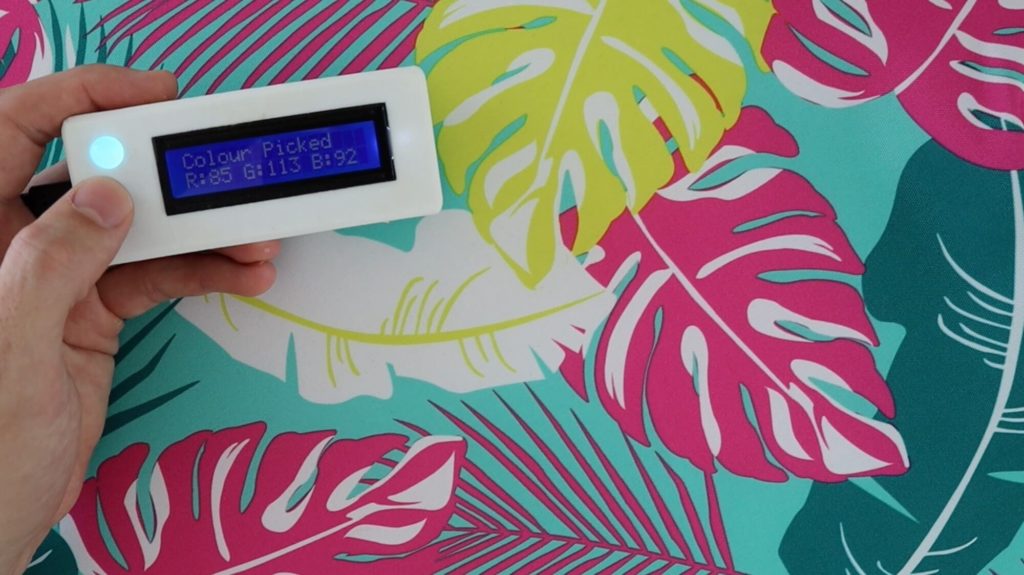
If you want a red piece of paper, or a blue pen, what does that really mean? If you’d like to get more specific, Michael Klements’ Arduino-based scanner lets you quantify colors in numerical RGB values via a TCS34725 sensor.
User interface for the handheld device is extremely simple, with a single button to trigger the sensor and measure colors, along with a 16×2 panel. An optional RGB LED attempts to copy the shade of whatever object you’re aiming at, providing a handy reference to verify it’s working correctly.
You can see the build process in the video below, first constructed on a breadboard and then placed in a more permanent soldered configuration with a 3D-printed case.
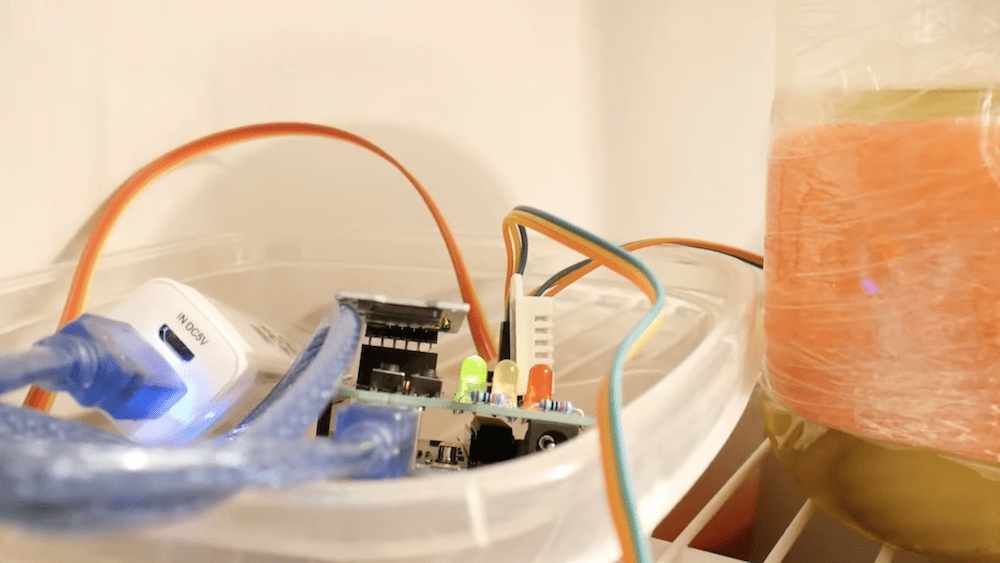
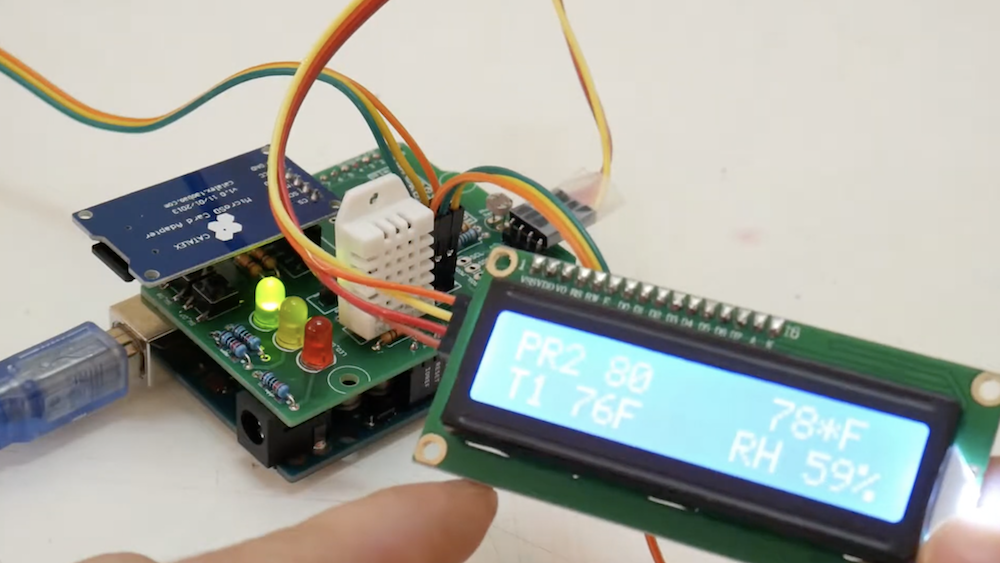
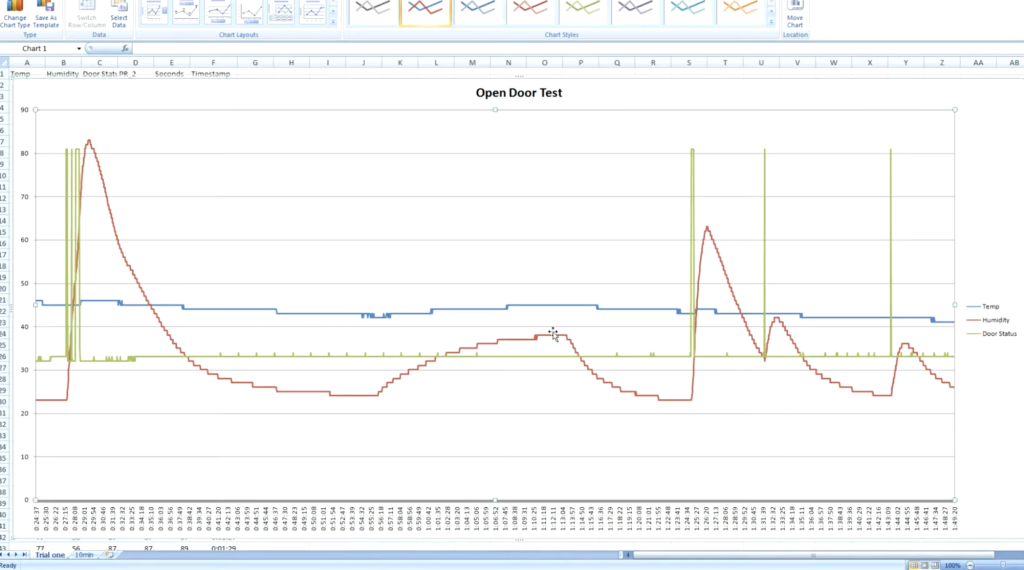
What really happens when you open the refrigerator door? Sure, you know intuitively that cold air escapes, but just how much? And how fast does the food inside actually heat up? To find out, Ryan Bates came up with his own data logging setup using an Arduino Uno, a custom sensor shield, and a microSD card reader.
His device uses a photoresistor to tell when the door has been opened, as well as a DHT22 temperature/humidity sensor to log the air temperature and door status. Along with this, TMP36 sensors are placed around the fridge to get a more granular look at temperatures, including one attached to a pickle jar.
This thermochromic 7-segment display colorfully shows the temp and humidity
Arduino Team — August 19th, 2019
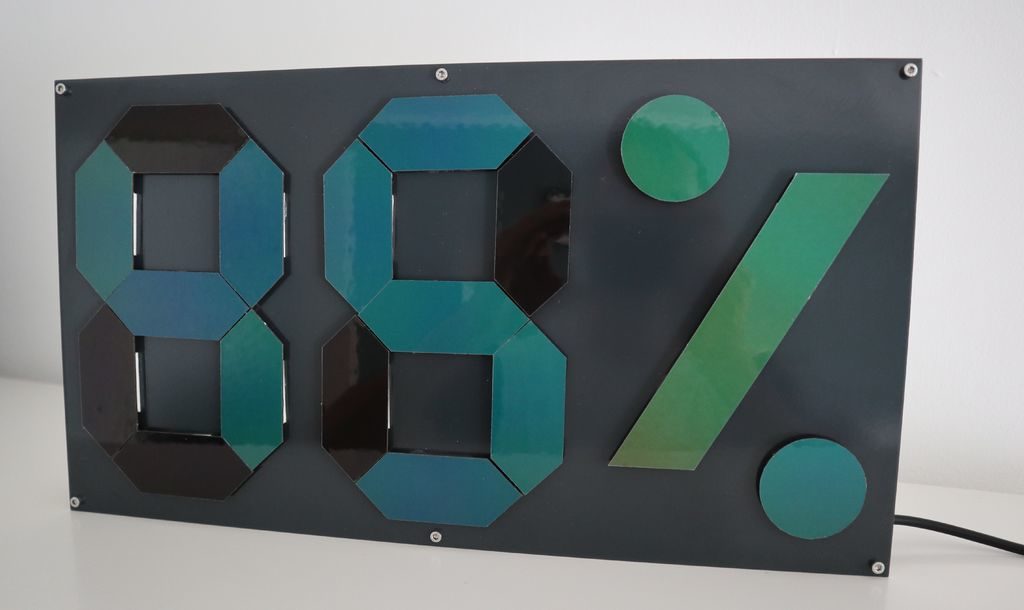
Instead of controlling his temperature and humidity display directly, maker Zaphunk did things a bit differently, driving the temperature of each segment with a Peltier element, or thermo-electric cooler (TEC), to change its color.
Each segment is made out of a thermochromic material, cycling from a black off state to a greenish hue when on, for a device that can—somewhat ironically—show the temperature by changing its temperature.
Ambient conditions are read via a DHT22 sensor, and everything is controlled by a half-dozen Arduino Nanos. This number boards were needed in order to power the nine dual motor drivers that handle the Peltier elements, each of which require two PWM outputs, along with 5 IO pins.
Arduino and industrial distance sensor communicate via RS-485
Arduino Team — August 5th, 2019
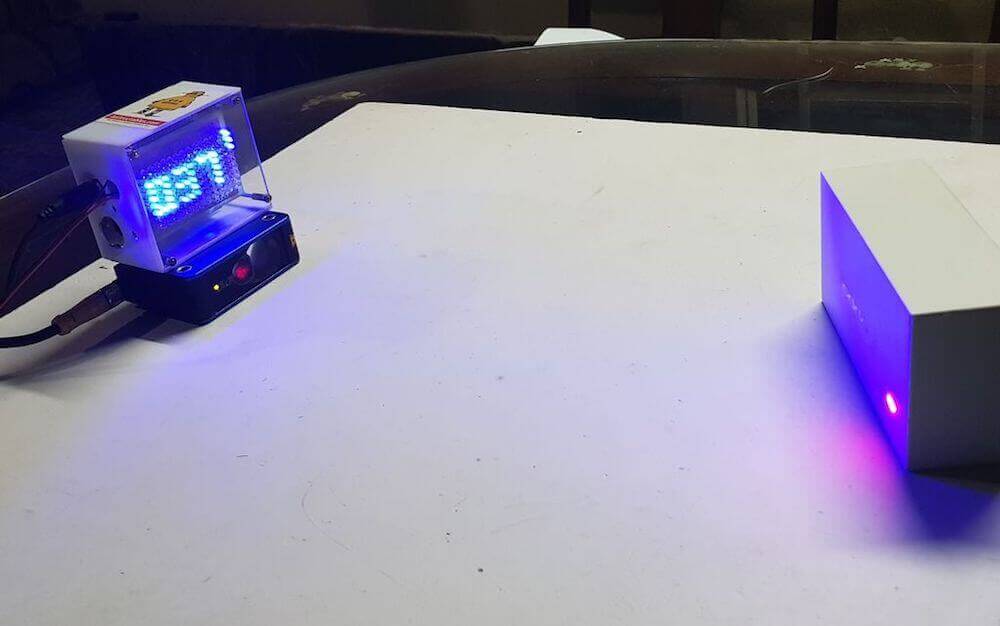
After obtaining an industrial distance sensor, TUENHIDIY decided to use it as the basis for an interesting visual indicator.
The device communicates with an Arduino Uno via an RS-485 module, and outputs distance values in the form of a 9 x 14 pixel display made out of discrete LEDs soldered onto an LoL Shield.
As shown in the video be low, it does a good job of sensing how far an object is from it on a table, and the 126 LEDs provide a nice brilliant display.
Code for the build can be found on GitHub if you’d like to make something similar. Seeing as though the sensor used here will set you back close to $1,000, you may want to also consider alternatives like an HC-SR04 ultrasonic module instead!
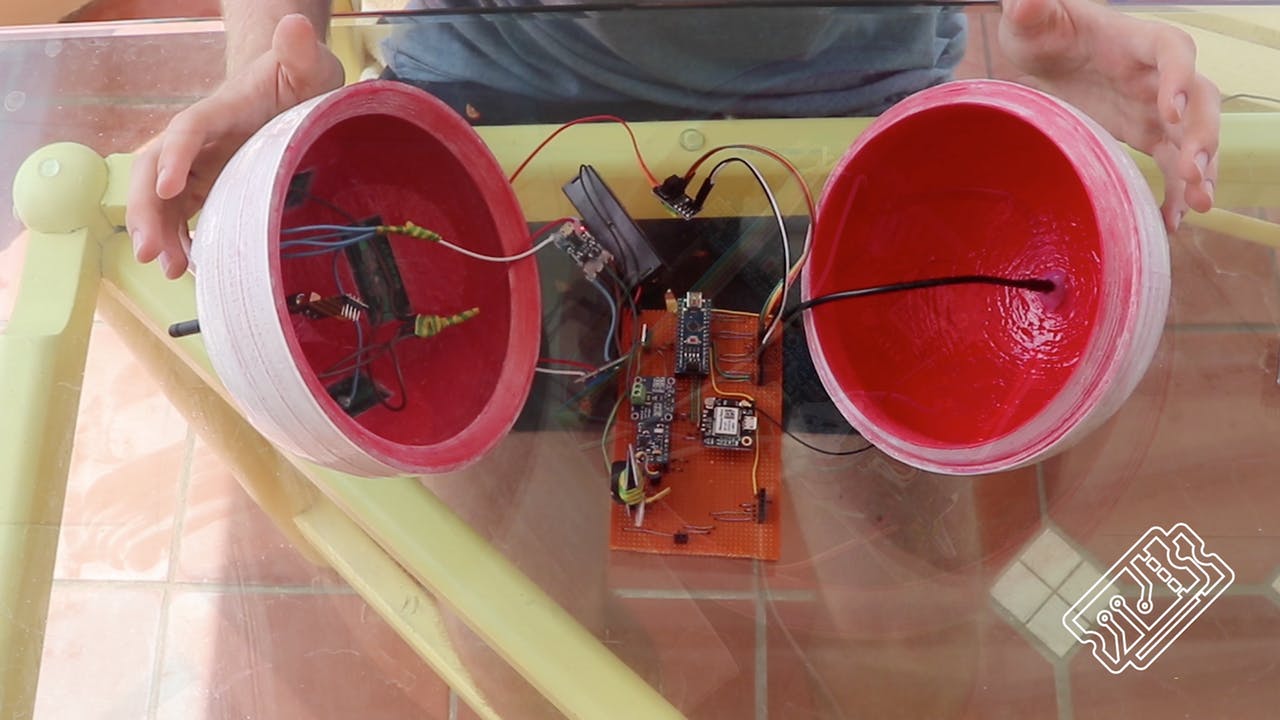
As their new YouTube video shows, the team at T3ch Flicks have been hard at work, designing and prototyping a smart buoy for marine conservation research.
We all love the seaside, right? Whether that’s the English seaside with ice creams and muddy piers or the Caribbean, with white sand beaches fringed by palm trees, people flock to the coast for a bit of rest and relaxation, to enjoy water sports or to make their livelihood.
What does a smart buoy do?
“The sensors onboard the smart buoy enable it to measure wave height, wave period, wave power, water temperature, air temperature, air pressure, voltage, current usage and GPS location,” explain T3ch Flicks on their project tutorial page. “All the data the buoy collects is sent via radio to a base station, which is a Raspberry Pi. We made a dashboard to display them using Vue JS.”
But why build a smart buoy to begin with? “The coast is a dynamic area at the mercy of waves. Rising sea levels nibble at beaches and powerful extreme events like hurricanes completely decimate them,” they go on to explain. “To understand how to save them, we need to understand the forces driving their change.”
It’s a pretty big ask of a 3D-printed dome but, with the aid of an on-board Raspberry Pi, Arduino and multiple sensors, their project was a resounding success. So much so that the Grenadian government gave the team approval to set the buoy free along their coast, and even made suggestions of how the project could be improved to aid them in their own research – pretty cool, right?
The project uses a lot of tech. A lot. So, instead of listing it here, why not head over to the hackster.io project page, where you’ll find all the ingredients you need to build your own smart buoy.
Good luck to the T3ch Flicks team. We look forward to seeing how the project develops.
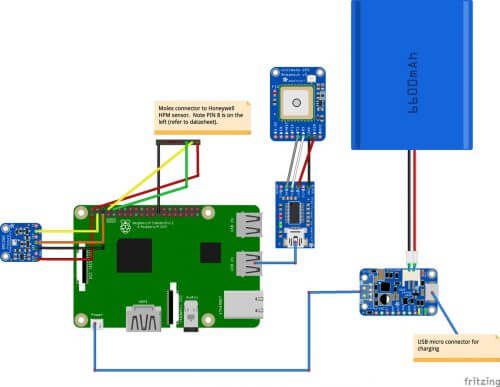
When James Puderer moved to Lima, Peru, his roadside runs left a rather nasty taste in his mouth. Hit by the pollution from old diesel cars in the area, he decided to monitor the air quality in his new city using Raspberry Pis and the abundant taxies as his tech carriers.
How to assemble the enclosure for my Taxi Datalogger project: https://www.hackster.io/james-puderer/distributed-air-quality-monitoring-using-taxis-69647e
Sensing air quality in Lima
Luckily for James, almost all taxies in Lima are equipped with the standard hollow vinyl roof sign seen in the video above, which makes them ideal for hacking.
With the onboard tech, the device collects data on longitude, latitude, humidity, temperature, pressure, and airborne particle count, feeding it back to an Android Things datalogger. This data is then pushed to Google IoT Core, where it can be remotely accessed.
Next, the data is processed by Google Dataflow and turned into a BigQuery table. Users can then visualize the collected measurements. And while James uses Google Maps to analyse his data, there are many tools online that will allow you to organise and study your figures depending on what final result you’re hoping to achieve.
James hopped in a taxi and took his monitor on the road, collecting results throughout the journey
James has provided the complete build process, including all tech ingredients and code, on his Hackster.io project page, and urges makers to create their own air quality monitor for their local area. He also plans on building upon the existing design by adding a 12V power hookup for connecting to the taxi, functioning lights within the sign, and companion apps for drivers.
Sensing the world around you
We’ve seen a wide variety of Raspberry Pi projects using sensors to track the world around us, such as Kasia Molga’s Human Sensor costume series, which reacts to air pollution by lighting up, and Clodagh O’Mahony’s Social Interaction Dress, which she created to judge how conversation and physical human interaction can be scored and studied.
Kasia Molga’s Human Sensor — a collection of hi-tech costumes that react to air pollution within the wearer’s environment.
Many people also build their own Pi-powered weather stations, or use the Raspberry Pi Oracle Weather Station, to measure and record conditions in their towns and cities from the roofs of schools, offices, and homes.
Have you incorporated sensors into your Raspberry Pi projects? Share your builds in the comments below or via social media by tagging us.
Um dir ein optimales Erlebnis zu bieten, verwenden wir Technologien wie Cookies, um Geräteinformationen zu speichern und/oder darauf zuzugreifen. Wenn du diesen Technologien zustimmst, können wir Daten wie das Surfverhalten oder eindeutige IDs auf dieser Website verarbeiten. Wenn du deine Einwillligung nicht erteilst oder zurückziehst, können bestimmte Merkmale und Funktionen beeinträchtigt werden.
Funktional
Immer aktiv
Die technische Speicherung oder der Zugang ist unbedingt erforderlich für den rechtmäßigen Zweck, die Nutzung eines bestimmten Dienstes zu ermöglichen, der vom Teilnehmer oder Nutzer ausdrücklich gewünscht wird, oder für den alleinigen Zweck, die Übertragung einer Nachricht über ein elektronisches Kommunikationsnetz durchzuführen.
Vorlieben
Die technische Speicherung oder der Zugriff ist für den rechtmäßigen Zweck der Speicherung von Präferenzen erforderlich, die nicht vom Abonnenten oder Benutzer angefordert wurden.
Statistiken
Die technische Speicherung oder der Zugriff, der ausschließlich zu statistischen Zwecken erfolgt.Die technische Speicherung oder der Zugriff, der ausschließlich zu anonymen statistischen Zwecken verwendet wird. Ohne eine Vorladung, die freiwillige Zustimmung deines Internetdienstanbieters oder zusätzliche Aufzeichnungen von Dritten können die zu diesem Zweck gespeicherten oder abgerufenen Informationen allein in der Regel nicht dazu verwendet werden, dich zu identifizieren.
Marketing
Die technische Speicherung oder der Zugriff ist erforderlich, um Nutzerprofile zu erstellen, um Werbung zu versenden oder um den Nutzer auf einer Website oder über mehrere Websites hinweg zu ähnlichen Marketingzwecken zu verfolgen.