We’re excited to announce the release of our latest Arduino Cloud feature, the Advanced Chart Widget! This new and improved widget is a significant upgrade from our previous chart widget, offering more customization options and functionality that will make it easier than ever to visualize and analyze your device data. In this blog post, we’ll be exploring the benefits of the Advanced Chart Widget, how to use it, and how you can take advantage of this new feature.
Your devices always monitored with the Arduino Cloud dashboards
But, what is the Arduino Cloud? Arduino Cloud is an integrated platform that provides an easy and efficient way to develop, deploy and manage IoT devices. Supporting a broad list of hardware, including Arduino boards, ESP32 and ESP8266 based boards, the platform enables makers, IoT enthusiasts and professionals to build connected projects effortlessly. What sets Arduino Cloud apart is its user-friendly and intuitive interface that abstracts complex tasks, making it accessible to users who are not familiar with coding.
Users can build dashboards from a rich palette of widgets, that include switches, buttons, colour selectors, status, gauges, maps and, of course, a chart widget where you can plot the temporal evolution of one variable of one device.
Benefits of the Advanced Chart Widget
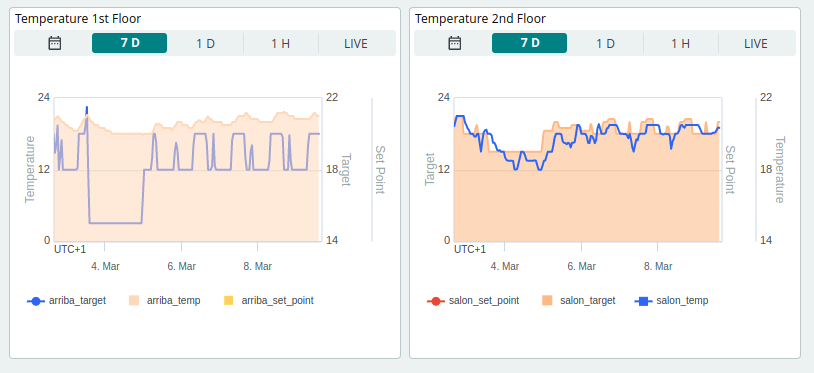
The Advanced Chart Widget is a powerful tool for monitoring and analyzing device data. Its ability to display multiple variables in one chart allows for easy comparison of data points, making it particularly useful for tracking multiple data streams such as temperature and humidity in a greenhouse, or energy usage in a building.
Moreover, the Advanced Chart Widget is highly customizable, allowing you to tailor it to your specific needs. You can adjust the colors and types of the charts, the labels on the axes and the legend to make the data easier to read and interpret.
One limitation of the standard Chart widget is its inability to display data over custom time periods. It only offers four predefined time spans: real time, 1 hour, 1 day, and 15 days. However, the Advanced Chart Widget offers the ability to select an arbitrary period of time, giving users access to the full history of their device data, according to the retention period of their plan. This is a crucial advantage for users who need to track long-term trends and patterns, enabling them to make informed decisions based on their device’s complete data history.

Real-world use cases
The Advanced Chart Widget has a wide range of use cases, from monitoring environmental conditions to tracking energy consumption. For example, you could use the widget to monitor the temperature and humidity in a greenhouse to ensure optimal growing conditions for your plants. Alternatively, you could use it to track energy consumption in a building and identify areas where you can reduce your energy usage. With the ability to display multiple variables in one chart, the possibilities are endless!
How to use the Advanced Chart Widget
Using the Advanced Chart Widget is easy!
Create your dashboard as usual, then click “Add Widget”. Select “Advanced Chart” from the list of available widgets.

Customise your chart by selecting the variables you want to show, choosing the chart type and colour for each variable, and configuring the Y-axes with the labels you want to use. You can also choose whether to show a legend for your chart.

Once you’ve customised your chart, you can adjust its size and location on your dashboard. Remember that you can customise separate dashboard views for browsers or the mobile app.
Last but not least, an improved Percentage widget!
Good things come in pairs and we’re excited to announce the release of our new and improved Percentage widget. This latest update allows you to customize the widget with a variety of icons, making it easier to identify the purpose of the widget at a glance. Choose from a range of predefined icons, including battery, temperature, storage, and more. Plus, with the ability to set a threshold, the widget’s color will change when the value goes above or below a certain value, providing instant visual feedback. Whether you’re tracking your device’s battery life or monitoring your storage capacity, the improved Percentage widget is the perfect tool for keeping an eye on important metrics.

Learn more
If you want to learn more about the Arduino IoT Cloud, you can check the official documentation and resources available on the Arduino Cloud website.
You can learn more about the new Advanced Chart widget checking the documentation. Please note that the Advanced Chart widget is a feature available starting from the Maker plan, but we believe it is well worth the investment for anyone looking to get the most out of their device data. Upgrading to a paid subscription is easy, and you’ll gain access to additional features and support that will help you get the most out of our platform.
With the Advanced Chart Widget, it’s easy to create great-looking charts that help you understand your data at a glance. So why not give it a try today?
The post Improve your data analysis with the Advanced Chart Widget for Arduino Cloud appeared first on Arduino Blog.
Website: LINK
Schreibe einen Kommentar
Du musst angemeldet sein, um einen Kommentar abzugeben.