Pimoroni has brought out two add‑ons with screens: Pico Display and Pico Explorer. A very basic set of methods is provided in the Pimoroni UF2 file. In this article, we aim to explain how the screens are controlled with these low-level instructions, and provide a library of extra routines and example code to help you produce stunning displays.
You will need to install the Pimoroni MicroPython UF2 file on your Pico and Thonny on your computer.
All graphical programs need the following ‘boilerplate’ code at the beginning to initialise the display and create the essential buffer. (We’re using a Pico Explorer – just change the first line for a Pico Display board.)
import picoexplorer as display
# import picodisplay as display
#Screen essentials
width = display.get_width()
height = display.get_height()
display_buffer = bytearray(width * height * 2)
display.init(display_buffer)
This creates a buffer with a 16-bit colour element for each pixel of the 240×240 pixel screen. The code invisibly stores colour values in the buffer which are then revealed with a display.update() instruction.
The top-left corner of the screen is the origin (0,0) and the bottom-right pixel is (239,239).
Supplied methods
display.set_pen(r, g, b)
Sets the current colour (red, green, blue) with values in the range 0 to 255.
grey = display.create_pen(100,100,100)
Allows naming of a colour for later use.
display.clear()
Fills all elements in the buffer with the current colour.
display.update()
Makes the current values stored in the buffer visible. (Shows what has been written.)
display.pixel(x, y)
Draws a single pixel with the current colour at
point(x, y).
display.rectangle(x, y ,w ,h)
Draws a filled rectangle from point(x, y), w pixels wide and h pixels high.
display.circle(x, y, r)
Draws a filled circle with centre (x, y) and radius r.
display.character(78, 112, 5 ,2)
Draws character number 78 (ASCII = ‘N’) at point (112,5) in size 2. Size 1 is very small, while 6 is rather blocky.
display.text("Pixels", 63, 25, 200, 4)
Draws the text on the screen from (63,25) in size 4 with text wrapping to next line at a ‘space’ if the text is longer than 200 pixels. (Complicated but very useful.)
display.pixel_span(30,190,180)
Draws a horizontal line 180 pixels long from point (30,190).
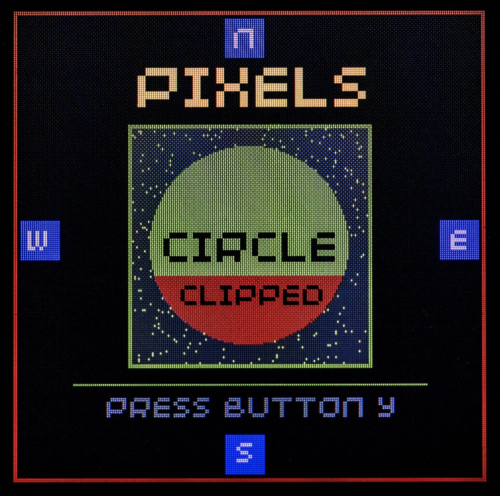
display.set_clip(20, 135, 200, 100)
After this instruction, which sets a rectangular area from (20,135), 200 pixels wide and 100 pixels high, only pixels drawn within the set area are put into the buffer. Drawing outside the area is ignored. So only those parts of a large circle intersecting with the clip are effective. We used this method to create the red segment.
display.remove_clip()
This removes the clip.
display.update()
This makes the current state of the buffer visible on the screen. Often forgotten.
if display.is_pressed(3): # Y button is pressed ?
Read a button, numbered 0 to 3.
This code demonstrates the built-in methods and can be downloaded here.
# Pico Explorer - Basics
# Tony Goodhew - 20th Feb 2021
import picoexplorer as display
import utime, random
#Screen essentials
width = display.get_width()
height = display.get_height()
display_buffer = bytearray(width * height * 2)
display.init(display_buffer)
def blk():
display.set_pen(0,0,0)
display.clear()
display.update()
def show(tt):
display.update()
utime.sleep(tt)
def title(msg,r,g,b):
blk()
display.set_pen(r,g,b)
display.text(msg, 20, 70, 200, 4)
show(2)
blk()
# Named pen colour
grey = display.create_pen(100,100,100)
# ==== Main ======
blk()
title(„Pico Explorer Graphics“,200,200,0)
display.set_pen(255,0,0)
display.clear()
display.set_pen(0,0,0)
display.rectangle(2,2,235,235)
show(1)
# Blue rectangles
display.set_pen(0,0,255)
display.rectangle(3,107,20,20)
display.rectangle(216,107,20,20)
display.rectangle(107,3,20,20)
display.rectangle(107,216,20,20)
display.set_pen(200,200,200)
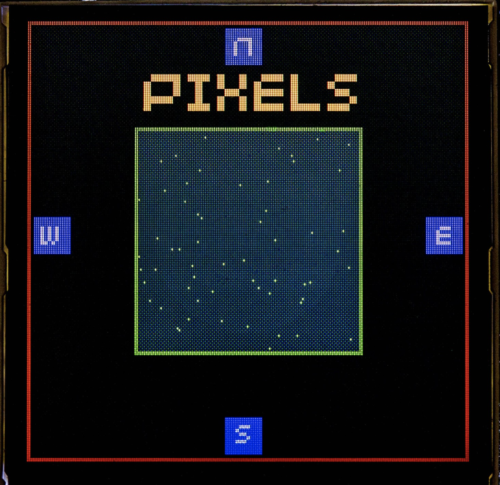
#Compass points
display.character(78,112,5,2) # N
display.character(83,113,218,2) # S
display.character(87,7,110,2) # W
display.character(69,222,110,2) # E
show(1)
# Pixels
display.set_pen(255,255,0)
display.text(„Pixels“, 63, 25, 200, 4)
display.set_pen(0,200,0)
display.rectangle(58,58,124,124)
display.set_pen(30,30,30)
display.rectangle(60,60,120,120)
display.update()
display.set_pen(0,255,0)
for i in range(500):
xp = random.randint(0,119) + 60
yp = random.randint(0,119) + 60
display.pixel(xp,yp)
display.update()
show(1)
# Horizontal line
display.set_pen(0,180,0)
display.pixel_span(30,190,180)
show(1)
# Circle
display.circle(119,119,50)
show(1.5)
display.set_clip(20,135, 200, 100)
display.set_pen(200,0,0)
display.circle(119,119,50)
display.remove_clip()
display.set_pen(0,0,0)
display.text(„Circle“, 76, 110, 194, 3)
display.text(„Clipped“, 85, 138, 194, 2)
display.set_pen(grey) # Previously saved colour
# Button Y
display.text(„Press button y“, 47, 195, 208, 2)
show(0)
running = True
while running:
if display.is_pressed(3): # Y button is pressed ?
running = False
blk()
# Tidy up
title(„Done“,200,0,0)
show(2)
blk()
We’ve included three short procedures to help reduce code repetition:
def blk()
This clears the screen to black – the normal background colour.
def show(tt)
This updates the screen, making the buffer visible and then waits tt seconds.
def title(msg,r,g,b)
This is used to display the msg string in size 4 text in the specified colour for two seconds, and then clears the display.
As you can see from the demonstration, we can accomplish a great deal using just these built-in methods. However, it would be useful to be able to draw vertical lines, lines from point A to point B, hollow circles, and rectangles. If these are written as procedures, we can easily copy and paste them into new projects to save time and effort.
In our second demonstration, we’ve included these ‘helper’ procedures. They use the parameters (t, l, r, b) to represent the (top, left) and the (right, bottom) corners of rectangles or lines.
def horiz(l,t,r): # left, top, right
Draws a horizontal line.
def vert(l,t,b): # left, top, bottom
Draws a vertical line.
def box(l,t,r,b): # left, top, right, bottom
Draws an outline rectangular box.
def line(x,y,xx,yy):
Draws a line from (x,y) to (xx,yy).
def ring(cx,cy,rr,rim): # Centre, radius, thickness
Draws a circle, centred on (cx,cy), of outer radius rr and pixel thickness of rim. This is easy and fast but has the disadvantage that it wipes out anything inside ring.
def ring2(cx,cy,r): # Centre (x,y), radius
Draw a circle centred on (cx,cy), of radius rr with a single-pixel width. Can be used to flash a ring around something already drawn on the screen. You need to import math as it uses trigonometry.
def align(n, max_chars):
This returns a string version of int(n), right aligned in a string of max_chars length. Unfortunately, the font supplied by Pimoroni in its UF2 is not monospaced.
The second demonstration is too long to print, but can be downloaded here.
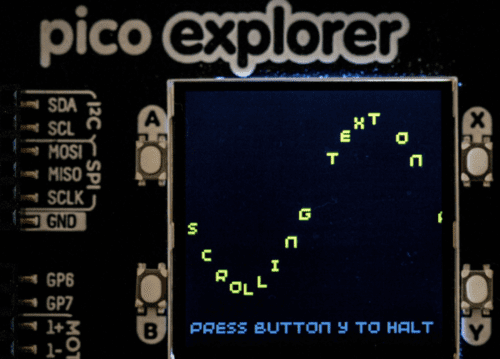
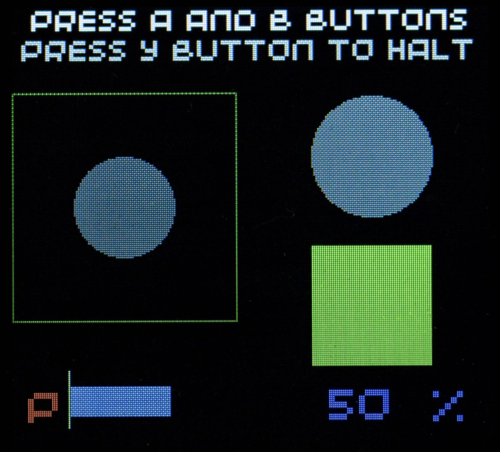
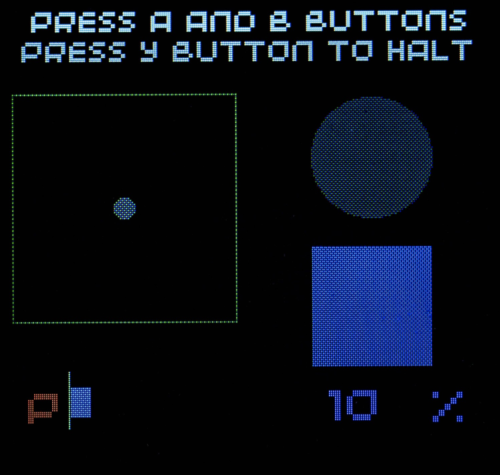
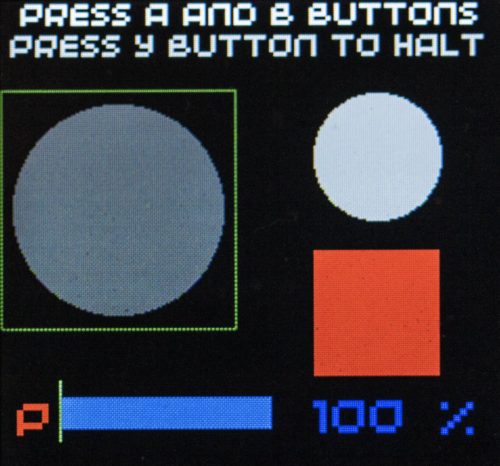
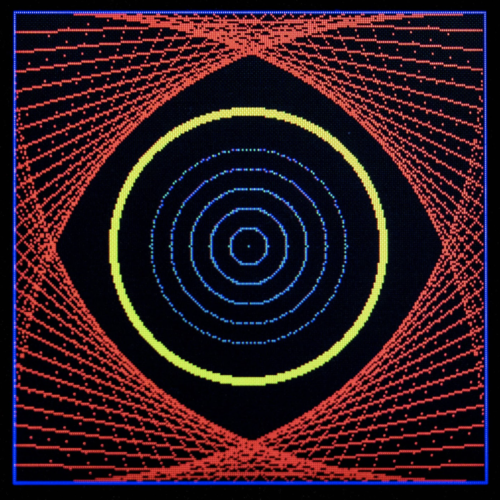
It illustrates the character set, drawing of lines, circles and boxes; plotting graphs, writing text at an angle or following a curved path, scrolling text along a sine curve, controlling an interactive bar graph with the buttons, updating a numeric value, changing the size and brightness of disks, and the colour of a rectangle.
The program is fully commented, so it should be quite easy to follow.
The most common coding mistake is to forget the display.update() instruction after drawing something. The second is putting it in the wrong place.
When overwriting text on the screen to update a changing value, you should first overwrite the value with a small rectangle in the background colour. Notice that the percentage value is right-aligned to lock the ‘units’ position.
It’s probably not a good idea to leave your display brightly lit for hours at a time. Several people have reported the appearance of ‘burn’ on a dark background, or ‘ghost’ marks after very bright items against a dark background have been displayed for some time. We’ve seen them on our display, but no long-term harm is evident. Blanking the screen in the ‘tidy-up’ sequence at the end of your program may help.
We hope you have found this tutorial useful and that it encourages you to start sending your output to a display. This is so much more rewarding than just printing to the REPL.
If you have a Pimoroni Pico Display, (240×135 pixels), all of these routines will work on your board.
Issue 41 of HackSpace magazine is on sale NOW!
Each month, HackSpace magazine brings you the best projects, tips, tricks and tutorials from the makersphere. You can get it from the Raspberry Pi Press online store or your local newsagents. As always, every issue is free to download from the HackSpace magazine website.
Website: LINK
Schreibe einen Kommentar
Du musst angemeldet sein, um einen Kommentar abzugeben.