
In this article from the latest issue of HackSpace magazine, Rob Miles takes a look at debugging. You’ll find what a debugger does and discover how to add hardware that can be used to tell us what our devices are really thinking.
Bug origins
Whenever your program doesn’t do what you want it to, you’ve got a bug. An early bug was an insect that got stuck in the contacts of an early computer. Bugs can be caused by many things, including poor specification, programmer error, or plain bad luck. The very first programmers had no way of fixing their bugs other than staring at their code and trying to work out what had gone wrong. However, if you are writing a program on a desktop computer today, one of the tools at your disposal will be your trusty debugger. This allows you to stop a program, look at what it is doing, and then continue, or even step through individual program statements.
Building code for debugging
To understand how a debugger works, we can start by considering the compilation process. Some languages, including C++, are compiled. A program called a compiler converts program source code into low-level machine code which tells the hardware what to do. This machine code is loaded into the target computer which runs your code. To see how this works, consider the following loop function.
void loop() {
  i = i + 1;
  j = j  - 1;
}
Each time the loop function is called, it will add 1 to the value in the variable i and subtract 1 from the value in the variable j. We might want to run this function on an ESP32 device. This can’t understand C++ statements, so the compiler converts them into a sequence of instructions that it can understand.
In the Figure 2 table, you can see the instructions produced by the compiler for the statements in the loop function. They have been simplified slightly and a description added. The first column shows the address in memory of that instruction. Computers store programs and data in numbered locations. When a program is running, the processor takes machine code instructions from a location and performs them. It then moves down memory to the next instruction. The instructions from the loop function are stored in memory starting at location number 83.
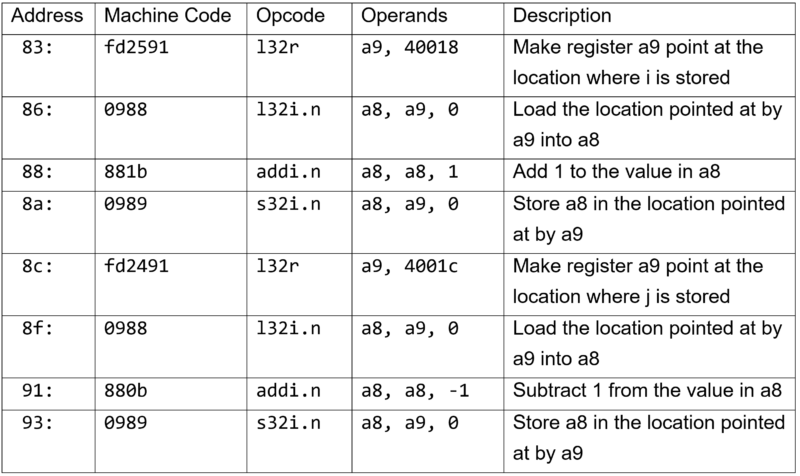
The second column shows the machine code values stored in the ESP32. The first instruction is made up of three bytes which have the values 0xfd (in hex), 0x25, and 0x92. When the program is running, the ESP32 decodes and performs these instructions.
The opcode column contains the name of the operator, and the operands are the things that the operator works on. The opcode and operands columns aren’t needed by the ESP32: it only needs the machine code bytes. Those two columns are just for us to read. From them, we can work out that the variable i is being held in location 40018, and the variable j is held in location 4001C. It is also worth noting that the ESP32 performs subtraction by adding a negative number.
Breaking in is hard to do
If the loop function above is not doing what we think it should be, then we can look at the values in i and j each time it runs. One way to do this would be to replace the machine code instruction at location 83 with an instruction that jumps into some debugging code that we can use to view the contents of our variables. When the program reaches this statement in the program, it would enter our debugger. This is called setting a breakpoint in the code. The debugger could show the contents of the registers and then we could tell the debugger to jump back into the loop function and continue execution of our program.
To create a breakpoint, the debugger program uses information provided by the compiler which tells the debugger where all the variables are stored and the location of each program statement. This information is produced when a program is compiled in ‘debug’ mode. The debugger uses this to work out where to insert the breakpoint code that will pause the program. This works well if the debugger is running on the same computer as the program being debugged. However, when we are writing programs for an embedded device, this is not the case. ESP32 code is sent from our computer into the target device to run. There is no way that the debugger can set a breakpoint by modifying the program code because it doesn’t have access to it. So, how can we put breakpoints into code running inside an embedded device?
We’ve been expecting you, Mr Bond
In the early days of embedded development, developers used versions of processors called ‘bond-out’ devices. These were special versions of processors which brought out the internal signals, including the address lines that identified the memory location that the hardware was accessing at any given instant. These chips were made by ‘bonding’ extra wires to the internal circuitry, hence the name.
Developers used hardware that monitored the addresses being used and detected when particular locations were being read or written. This extra hardware, called an ‘in-circuit emulator’, was the only way to debug early embedded code. To debug our loop function, we would tell the hardware to stop the device when it detected an attempt to read from the program memory at address 83 (where the machine code for the loop function starts). The circuitry would then read the registers in the device and allow us to view their contents. This method worked well, but the emulators were expensive and only large companies could afford them.
Enter JTAG
As the power and complexity of microprocessors grew, it became harder to make bond-outs to expose all the internal signals that make hardware debugging possible. To address this, manufacturers formed a Joint Tag Action Group (JTAG) to define standards by which a device can expose its internal state using just a few pins.
Many circuit boards have pins labelled JTAG which are used during manufacture and testing. Sometimes these pins can also be used for hardware debugging. Not all processors support hardware debugging connections. The ATmega328P processor used in the Arduino Uno cannot be debugged in this way. However, the ESP32 does provide these connections. Some of the general-purpose input/output (GPIO) pins on an ESP32 can be used as JTAG connectors. To debug code running in hardware, you’ll need some way of connecting your development computer to the JTAG signals on the target device. Espressif (the same company that makes the ESP32) produces a great device for this. It is called the ESP32-PROG.
The ESP32-PROG
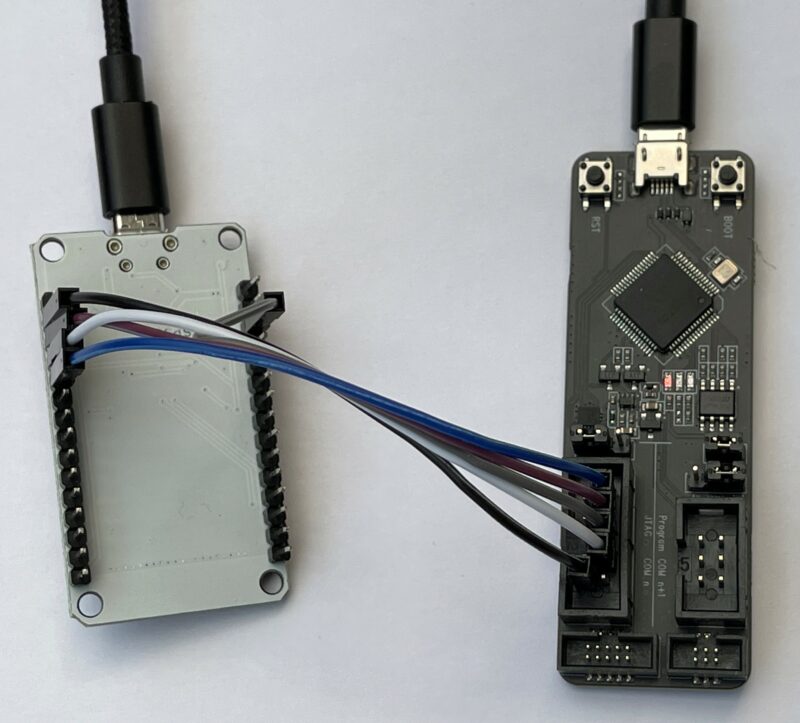
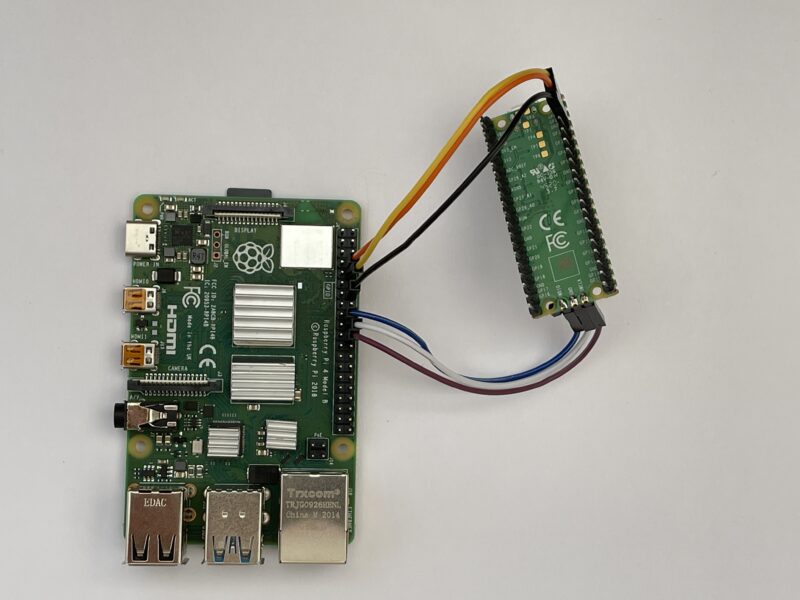
You can pick up an ESP32-PROG device for around £15 or so. It can also be used to program an ESP32. It can be connected via a ribbon cable or you can use DuPont cables (socket to socket), as shown in Figure 1.

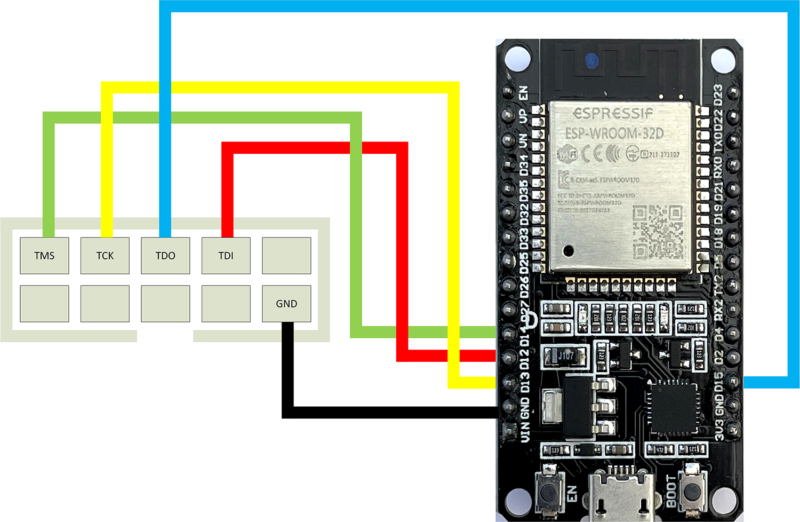
The table above shows the connections between an ESP32 and the ESP-PROG device.
Figure 3 shows how the socket on the ESP-PROG can be connected to an ESP32 device. Note that both the ESP32 and the ESP-PROG will need to be connected to a power source via their micro USB connectors. You will still deploy your program using a connection to the ESP32 device. If you encounter problems with program deployment, disconnect the ESP32 USB cable from your PC and try again.
The OpenOCD connection
The debugging itself is managed by the ‘Open On-Chip Debugger’ (OpenOCD) software. This provides a connection between the hardware and the software environment that you use to write and debug your code. OpenOCD talks to the ESP-PROG device over USB. The ESP-PROG provides two serial port connections to the host computer. One can be used for programming an ESP32 via the 6-pin connector on the ESP-PROG. The other is used to control debugging.

Debugging with Visual Studio Code and PlatformIO
Visual Studio Code is a free development environment that runs on PC, Mac, and Raspberry Pi. PlatformIO is a free plug-in for embedded development using Visual Studio Code. PlatformIO includes the OpenOCD framework. A PlatformIO project contains a platform.ini file that contains the project configuration options. We need to edit this file and add two lines to our configuration:
debug_tool = esp-prog
debug_init_break = tbreak setup
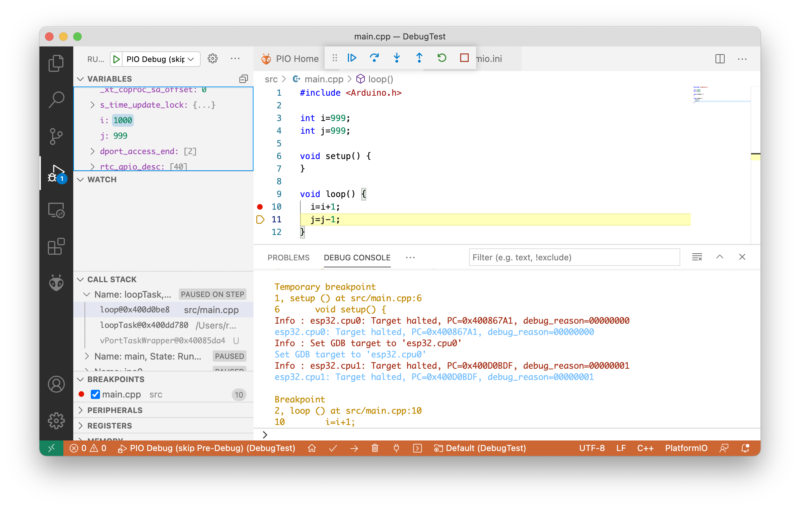
Now we can open up the debug window in Visual Studio Code and start the debugger.
Hardware debugging with Raspberry Pi PICO
The Raspberry Pi Pico device exposes JTAG signals that can be used for hardware debugging. You can wire these directly to a Raspberry Pi and use that as the debugging and development platform, or you can use another Raspberry Pi Pico device as a debugging probe.
The Pico documentation gives detailed instructions on how to do this here. You can use the GNU Debugger to debug a program from the command line.
(gdb) b main
Breakpoint 1 at 0x1000035c: file /home/pi/pico/pico-examples/blink/blink.c, line 9.
(gdb) continue
Continuing.
Thread 1 hit Breakpoint 1, main () at /home/pi/pico/pico-examples/blink/blink.c:9
9       int main() {
(gdb) step
14          gpio_init(LED_PIN);
The statements above are from a GDB debug session investigating the blink demo program for the Pico. The debugging commands that were entered are shown in bold. You can see a breakpoint being set on the main method, and then the program stepping on from the breakpoint to the first statement which initialises the LED. If you want to use Visual Studio Code to debug your programs on Raspberry Pi, you can do this as well.
Hardware debugging for the win
Hardware debugging is very powerful. It lets you look inside your devices to see exactly what they are doing. You do need to be a bit careful when you use it sometimes, because the debugging process stops the target device and all background processes. On a device like the ESP32, this can cause problems with WiFi and Bluetooth connections being maintained during debugging. However, given the low cost of getting started, you should definitely consider adding the technique to your armoury of tools.
Issue 43 of HackSpace magazine is on sale NOW!
Each month, HackSpace magazine brings you the best projects, tips, tricks and tutorials from the makersphere. You can get it from the Raspberry Pi Press online store or your local newsagents.
As always, every issue is free to download from the HackSpace magazine website.
Website: LINK
Schreibe einen Kommentar
Du musst angemeldet sein, um einen Kommentar abzugeben.