
4 new IoT monitoring dashboard updates on Arduino Cloud
Arduino Cloud recently received a major upgrade renewing the user interface and the Arduino Cloud editor. And as we promised it was just the beginning. This article dives into some of the new IoT monitoring dashboard features that may seem small, but pack a big punch for your connected projects.
1. Duplicate IoT Dashboards
Dashboards are the heart of the Arduino Cloud, allowing you to effortlessly monitor and control your devices. That’s why improving their functionality is crucial.
Even though creating an IoT dashboard is an easy task with the intuitive drag-and-drop interface, it can become a bit tedious when you have to replicate many of them and apply minor adjustments.
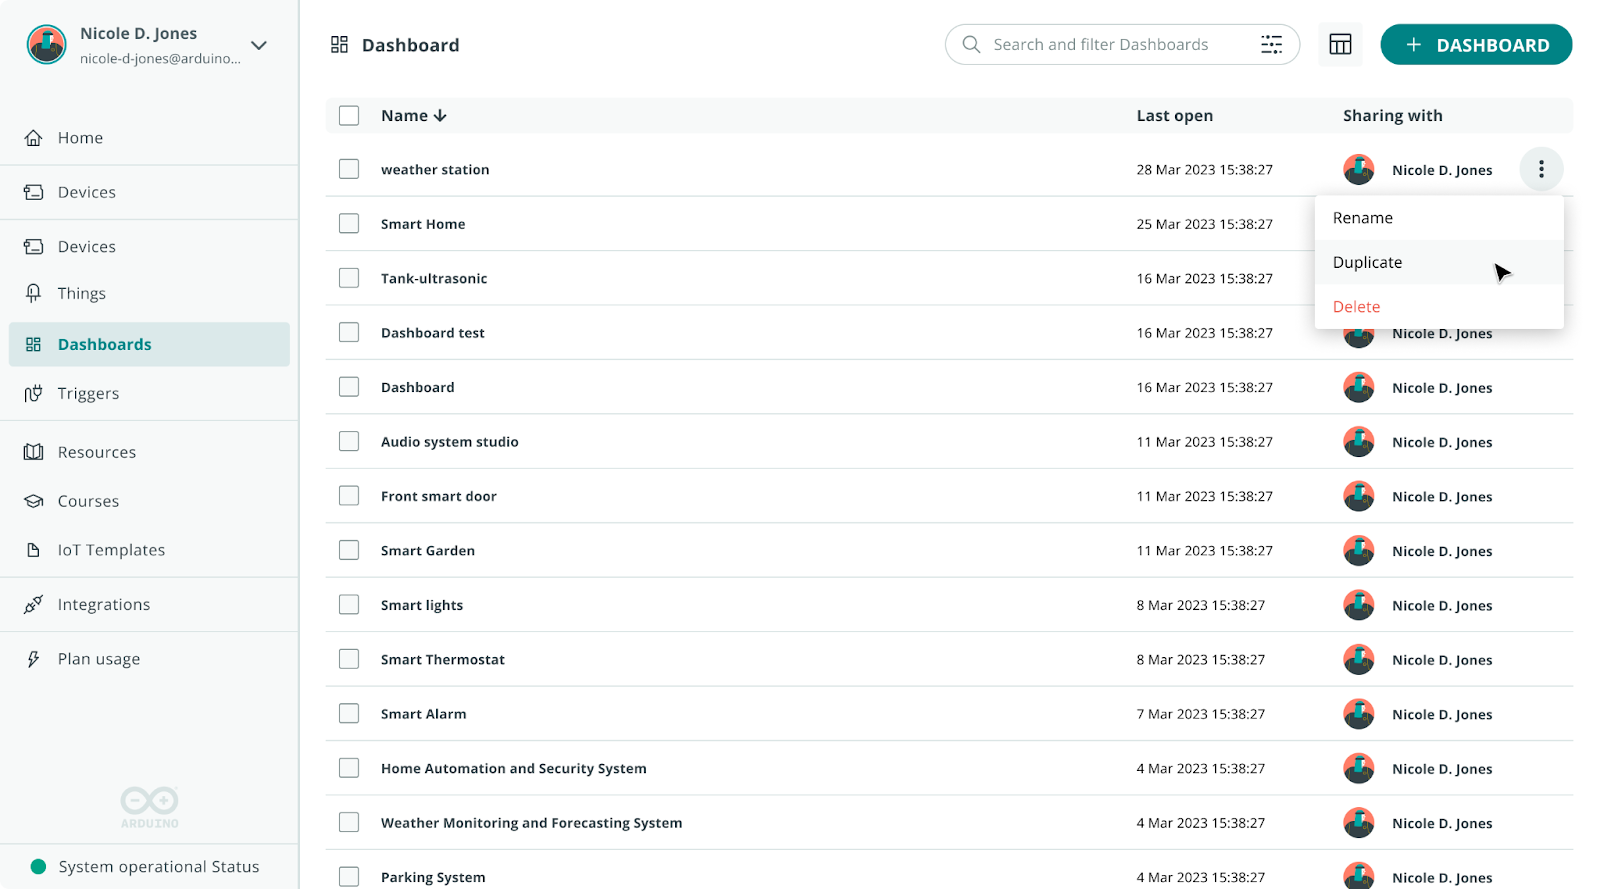
Now it is possible to duplicate your IoT dashboards with just one click. Just click on the three dots (?) of the dashboard that you want to clone and select “Duplicate.” This creates a copy that you can customize to meet your specific needs.
2. Customize your IoT Value Widget
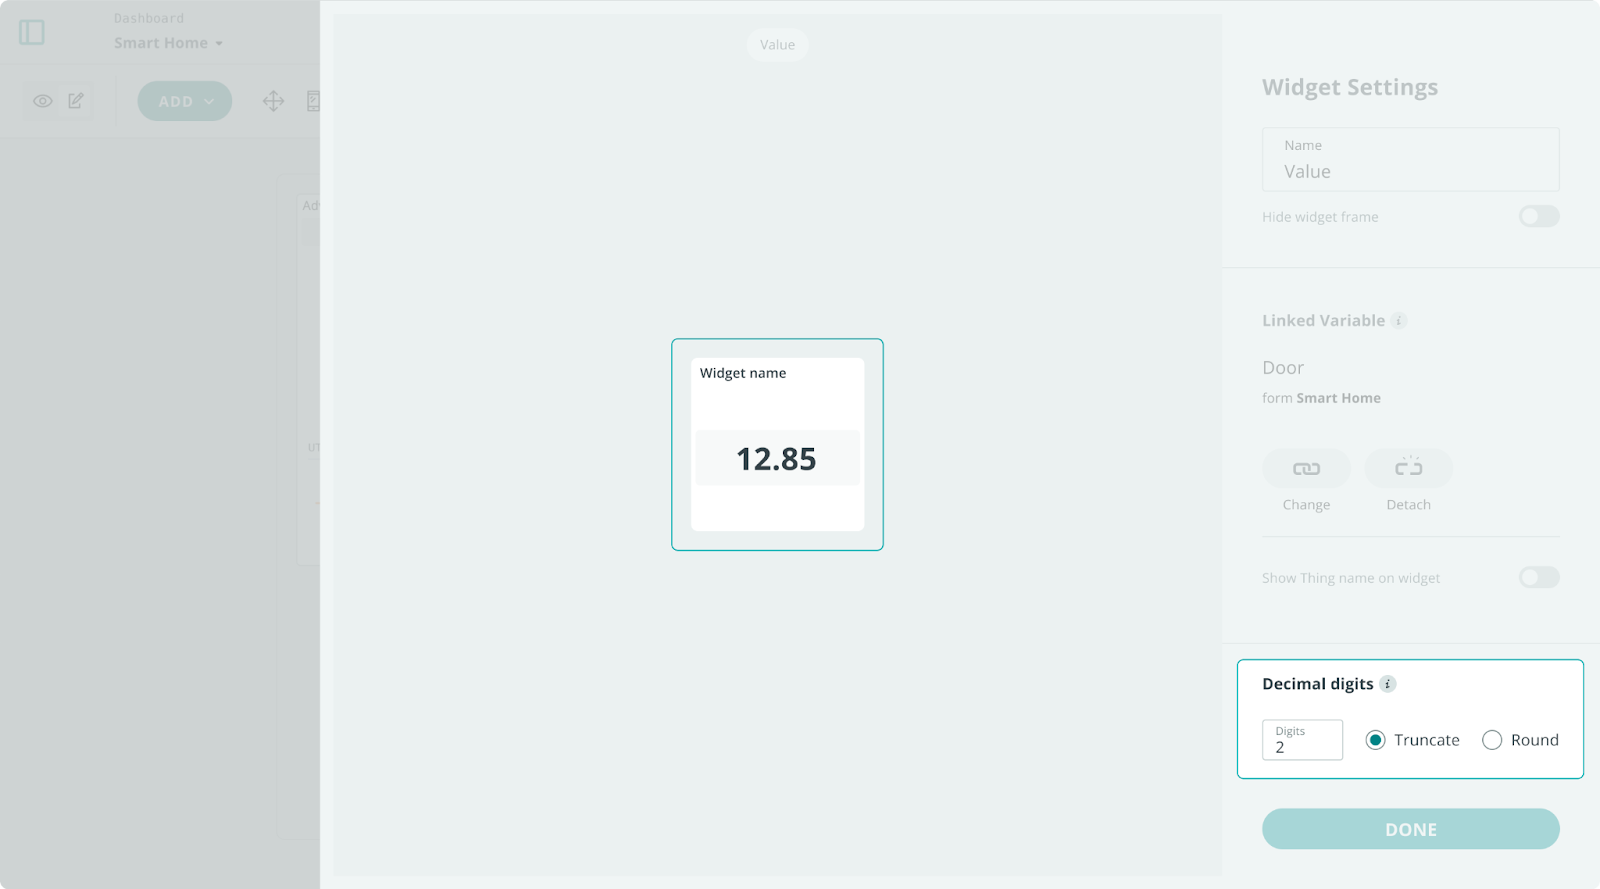
Customizing widgets has been a common request from our user community, and we’ve recently addressed this with the introduction of decimal settings in the “Value” widget. This much-awaited feature allows users to configure the number of decimal digits displayed in the widget when dealing with floating-point variable types.
When selecting a floating-point variable type, users can specify the decimal precision shown in the widget and choose whether to truncate or round the value. Importantly, this setting only affects the visualization, not the actual variable value.
3. Enjoy the new data aggregation method in Advanced Chart widget
Advanced chart widgets are one of the most popular widgets for data analysis as they help you improve your data analysis. The widget now includes support for configuring the data aggregation method.
But what does it mean?
The chart widgets come with a smart implicit feature known as data aggregation. To prevent the chart from becoming too messy with an excess of data points, there is a fixed limit of data points per chart:
- If the number of data points to show is lower than the maximum number of data points, there is no aggregation.
- If the number of data points to show is bigger than the maximum number of data points, data is aggregated.
Before this update, there was only an implicit aggregation method, which was the average.
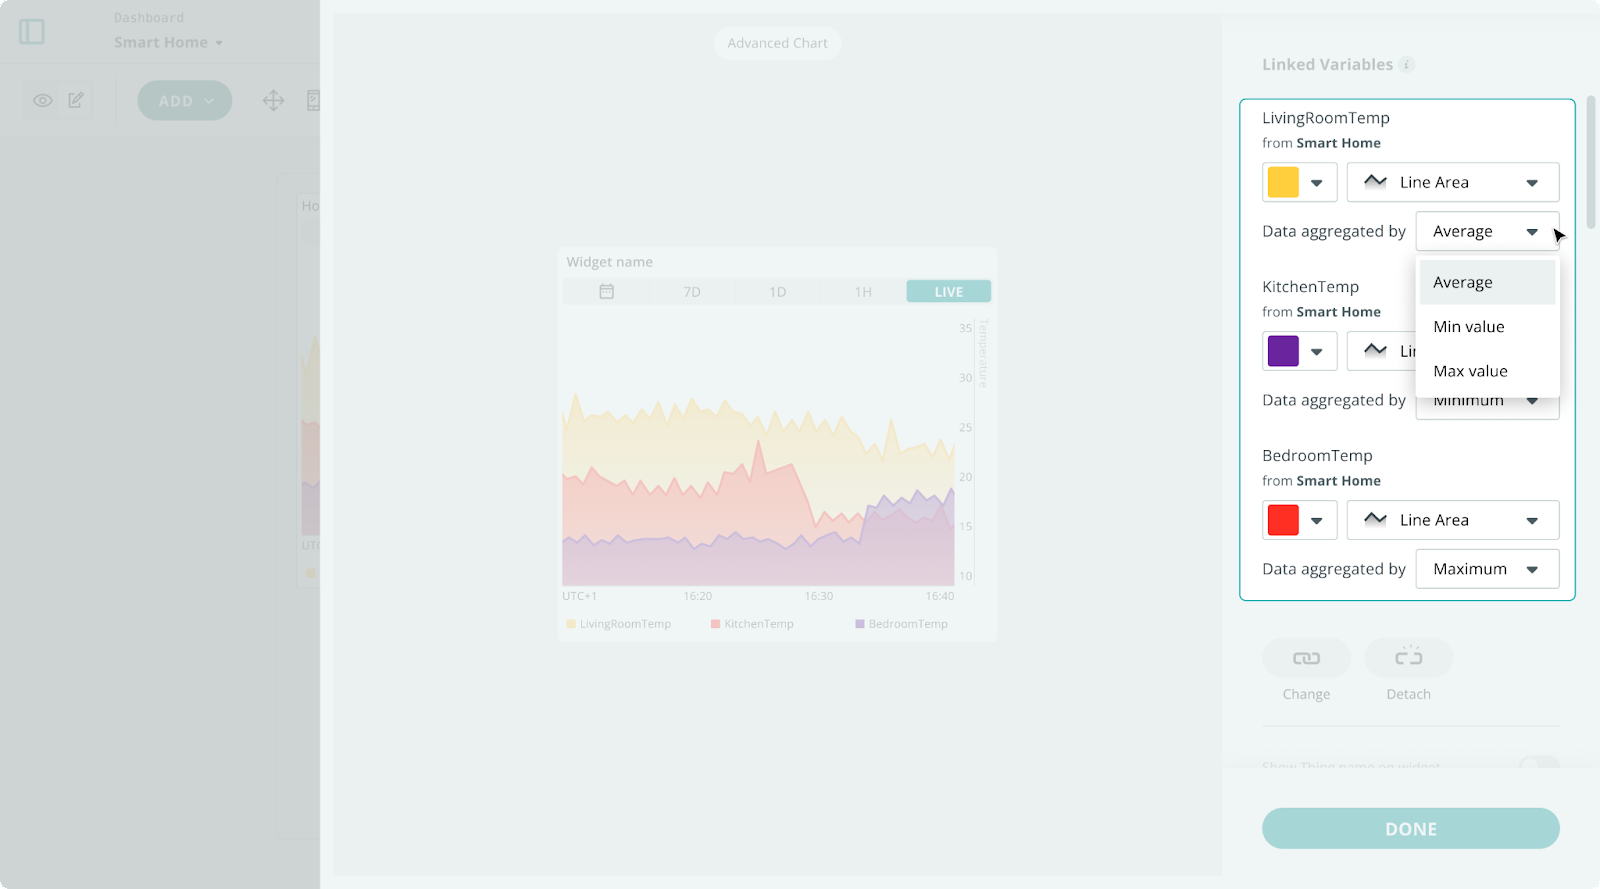
With this new Advanced Chart widget feature, you can now choose the aggregation method that suits your needs. Options include average, max value, and min value:
- Average: Calculates the average of the data for each aggregation period.
- Max value: Uses the maximum value within the aggregation period.
- Min value: Uses the minimum value within the aggregation period.
This enhancement is a direct result of the feedback from our community. It’s a feature that has long been requested by users, and we’re happy to finally deliver it.
Check out this article if you want to learn more about Advanced Chart widgets.
4. Deploy ready-to-use dashboards and firmware for your ESP32 devices
Templates are one of the most popular features of the Arduino Cloud. You can select a ready-to-use solution and deploy it with one click. You get the software and an IoT monitoring dashboard. If you need to do modifications for your IoT project, you can just edit the code and dashboard and off you go! It’s a fun and easy way to get started.
The exciting thing is that two new dashboard templates for ESP32 boards are now available, complementing the offering for Arduino boards:
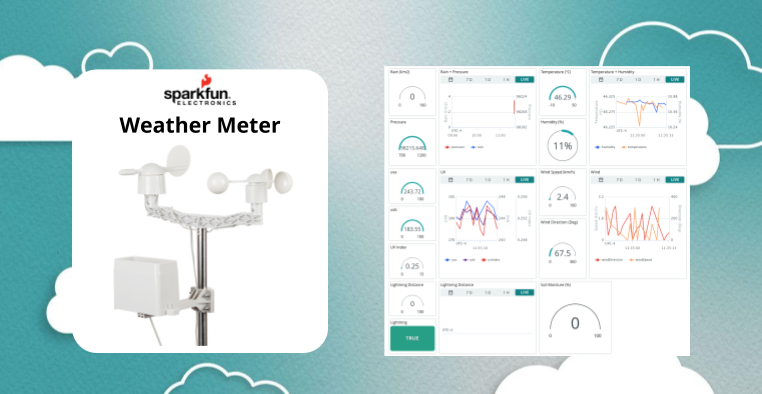
With the SparkFun Weather Station kit template, you can program the SparkFun Weather Station kit firmware and get a ready-to-use dashboard that shows information about wind, rain, and sunlight.
Check out the full list of templates to see the ones that fit you more.
Bonus: IoT widget preview
As a bonus, we’re also introducing a handy new feature – now when you add a widget to a dashboard, you’ll see a preview and description of the widget. This makes it even easier to choose the right widget for your dashboard and streamline your project setup process.

Get started with Arduino Cloud
The Arduino Cloud is free to use. Create your Arduino Cloud account today and explore how you can bring your projects to the next level. If you need enhanced functionality, you can check the premium features and redeem a code for a free 30-day trial.
Want to learn more about Arduino Cloud IoT monitoring dashboards?
The post 4 new IoT monitoring dashboard updates on Arduino Cloud appeared first on Arduino Blog.
Website: LINK