Build an oscilloscope using Raspberry Pi and Arduino
In this tutorial from The MagPi issue 71, Mike Cook takes us through the process of building an oscilloscope using a Raspberry Pi and an Arduino. Get your copy of The MagPi in stores now, or download it as a free PDF here.
The oscilloscope is on the wish list of anyone starting out with electronics. Your author used to tell his students that it was your eyes, making electricity visible. Unfortunately, they are quite expensive: from a few hundred pounds to up to £5000 and beyond. However, by using an Arduino and some software on the Raspberry Pi, you can make a passable beginner’s oscilloscope.
Last September, in The MagPi #61, there was an article outlining the way the Raspberry Pi and the Arduino could be used together. We at the Bakery have been doing this for some time: we first had a major project in the Raspberry Pi Projects books by Andrew Robinson and Mike Cook. The big advantage of the Arduino from a signal processing point of view is that there is minimal interruption from the operating system and you can gather data at a constant uninterrupted rate. This is just what we need for making an oscilloscope. The idea is that the Arduino gathers a whole heap of voltage samples as fast as it can and stores it in memory. It then transfers that memory to the Raspberry Pi, again as fast as possible. The Pi plots the data and displays it, then the software allows measurements to be made on the samples.
So you can measure the time and voltage difference, known as a delta, between any two points on the samples. You can even display the frequency that the ‘time delta’ corresponds to by taking its reciprocal. These are features found in expensive oscilloscopes. We have also built in a trigger function; this is to synchronise the onset of the rapid data gathering with the occurrence of a positive transition on the input signal through a specified voltage. The result is that regular waveforms can look stable on the display.
The hardware
The schematic of the Arduino data acquisition module is shown in Figure 1.
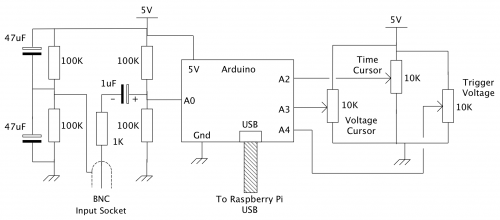
Figure 1: Schematic of the Arduino acquisition module
You will notice that it is quite simple. It consists of three potentiometers for the oscilloscope’s controls and an AC coupled biased voltage input.
The capacitor ensures that no DC components from the input get through and gives a modicum of protection against overvoltage. The reference voltage, or ground, is similarly biased as +2.5V above the Pi’s ground level.
The use of a BNC socket for the input ensures that you can use this with proper oscilloscope probe leads; these normally have an X10 switchable attenuator fitted, thus allowing voltages of +/- 25V to be measured. Full construction details can be found in the numbered steps.
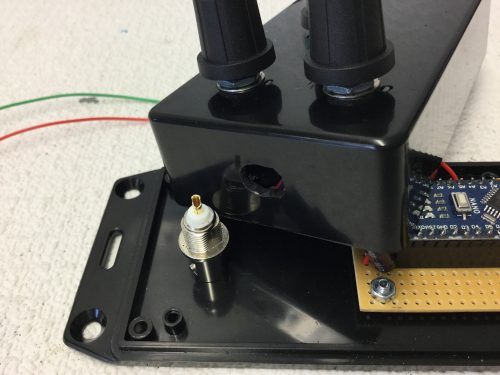
The BNC socket has a flat on each side of the thread to prevent it rotating with the twisting force it will be subjected to upon connecting any probe. We did this by first drilling an 8mm hole for the flats and then enlarging the hole with a circular file on each side to allow it to fit. An 8×12mm hole was filed opposite the USB connecter to allow access.
Arduino software
The software, or sketch, you need to put into the Arduino is shown in the Gather_A0.ino listing, and is quite simple. Normally an Arduino of this type will take samples at a rate of 10 000 per second — or as we say, a 10k sample rate. This is not too good for an oscilloscope, but we can increase this sample rate by speeding up the A/D converter’s clock speed from the default rate. It does not appear to affect the reading accuracy too much. By making this change, we can speed up the sample rate to 58k. This is much better and allows useful measurements to be made in the audio range.
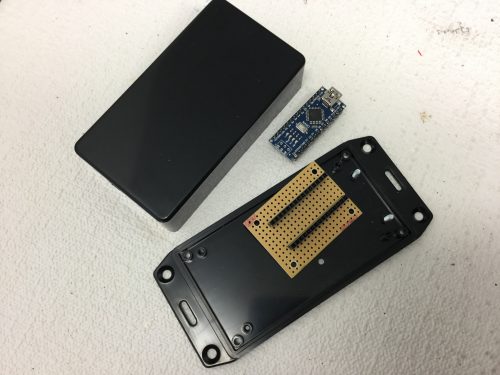
We used an Arduino Nano and soldered the header pins to it. Then we took a 14 hole by 19 strips piece of stripboard and drilled some holes to fix it to the base of the box. You might want to make this longer than 19 strips if you are not using surface-mount resistors on the underside. Fit header sockets to the stripboard and break the tracks on the underside between the two rows.
So, first, the trigger function is optionally called and then the samples are gathered in and sent to the Pi. The trigger function has a time-out that means it will trigger anyway after one second, whether it sees a transition on the input signal or not. Then the three pots are measured and also sent to the Pi. Note here that the samples are ten bits wide and so have to be sent as two bytes that get joined together again in the Pi’s software.
Also note the use of the double read for the pots, with a bit of code between each. This ensures a more stable reading, as the input capacitor of the Arduino’s sample and hold circuit needs time to charge up, and it has less time than normal to do this due to the speeding up of the D/A. It does not affect the waveform samples too much, as in most waveforms one sample voltage is close to the previous one.
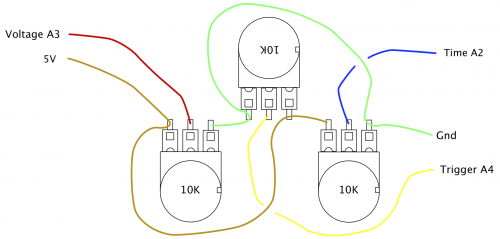
We then drilled three holes for the pots, and added the small slots for the anti-rotation lugs. Then we fitted the pots and wired them up using the diagram above. This is the view from inside the lid of the box; if you’re worried about touching the side of the box with your soldering iron, consider soldering them before attaching them to the box.
At the end of the transfer, the Arduino sits in a loop waiting for an acknowledge byte from the Pi so it can start again. This acknowledge byte also carries the information as to whether or not to use a trigger on the next sample.
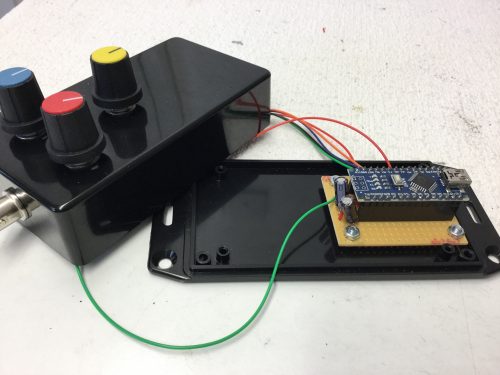
Add the resistors and capacitors to the stripboard and wire up the BNC socket. Solder this up before mounting, otherwise you will melt the plastic. Remember to thread the central wire through the ground washer, crinkle washer, and nut before soldering it. Add labels Trigger, Time, and Volts to the knobs.
Finally, before each buffer full of data is gathered, pin 13 on the board is lit, and turned off after. This is so that we could time the process on a commercial oscilloscope to find the sample rate — something you will not have to do if you use the recommended AVR-type Arduinos running at 16MHz.
Pi software
The software for the Raspberry Pi is written in Python 3 and used the Pygame framework. It proved to be a lot more tricky to write than we first imagined, and is shown in the Scope.py listing. Python 3 uses Unicode characters by default, and allowed us to display the delta (Δ) and mu (μ) Greek characters for the difference and the time. The code first sets up the non-display part of the window; this is only drawn once, and then parts of it are updated when necessary. Depending on what type of Arduino you have, it can show up as a different USB port; we found that ours showed up as one of two ports. Comment out which one is not applicable when defining the sampleInput variable at the start of the listing.
Finally, we cobbled together a 168×78 pixel logo for the top-left corner, using a piece of clip art and fashioning the word ‘Oscilloscope’ from an outlined version of the Cooper Black font. We called it PyLogo.png and placed it in an images folder next to the Python code.
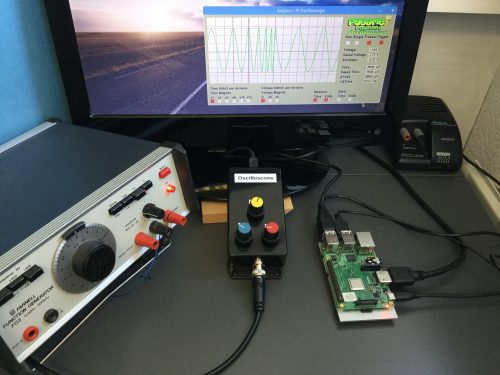
Using the oscilloscope
The oscilloscope samples at 58 kHz, which in theory means you can measure waveforms at 29 kHz. But that only gives you two samples per cycle, and as the samples can be anywhere on the waveform, they do not look very good. As a rough guide, you need at least ten points on a waveform to make it look like a waveform, so that gives a top practical frequency of 5.8 kHz. However, by using the Time Magnify options along with the Freeze function, you can measure much higher frequencies. The time and voltage cursor lines let you find out the values on any point of the waveform, and by clicking the Save functions, the current cursor is replaced by a dotted line that is fixed, and measurements can be made relative to that. The oscilloscope in action can be seen in Figure 2.
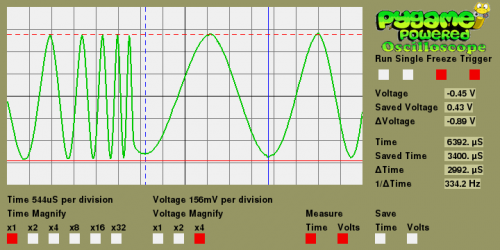
Figure 2: Taking measurements on a swept signal
Note that pressing the S key on the keyboard produces a screen dump of the display.
Taking it further
There are lots of ways you can take this project further. A simple upgrade would involve you having a second data buffer to allow you to display a saved waveform to compare against the current live one. You could also add a lower-speed acquisition mode to see slower waveforms. You can go the other way and use a faster Arduino so you can see the higher frequencies. This oscilloscope is AC coupled; you could add a DC coupling option with a switch potential divider and amplifier to the front end to extend the range of voltages you can measure. All these improvements, however, will need changes to the software to allow the measuring to take place on these wider-range parameters.
Finish the project
For the complete project code, download the free PDF of The MagPi issue 71, available on The MagPi website.
Website: LINK